Formulae: CountIF work around?
-
Hi Visokio - Hope someone can help me out.
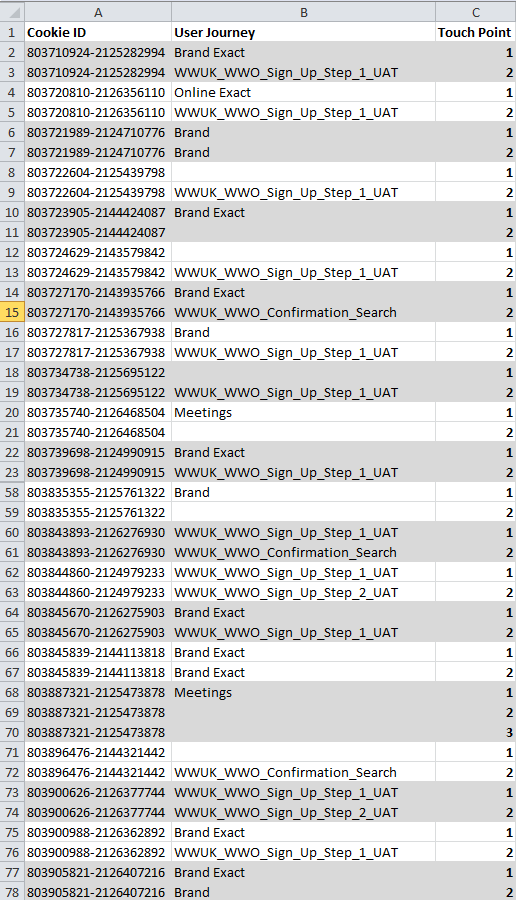
I am looking to generate a formula that can consecutively count all the occurrences of a value in another column. Maybe the attachment will help you to understand:
In Excel we have Cookie ID and the Touch Points column counts the consecutive individual events. Basically I want to replicate what is in the Excel image attachment in Omniscope.
The formula we use in Excel is below if that helps:
=IF(COUNTIF($A$1:$A$10,A1)>1,COUNTIF($A$1:A1,A1),"")
Thanks - Sherrick ChavdaAttachments
2012-10-19_1130.png 99K -
4 Comments
-
Hi, if you wish to count appearance of every Cookie ID, you should use Subset formulas
SUBSET_NONEMPTYCOUNT([Cookie ID], SUBSET([Cookie ID]))
You can also have different cookie count for every visit, where you see same ID, but at a different time. In that case you will use above formula, but will replace SUBSET with SUBSET2, that will combine [Cookie ID] with [Time] field.
In this scenario you will have to format the Time field to be a date field, and contain dd/MM/yyyy elements (day part can be hidden, but must be present in the field).
For a summary - list of cookie IDs and count against each - use Aggregation in the Table View, with Singleton as default function in your formula field. -
Hi Paola,
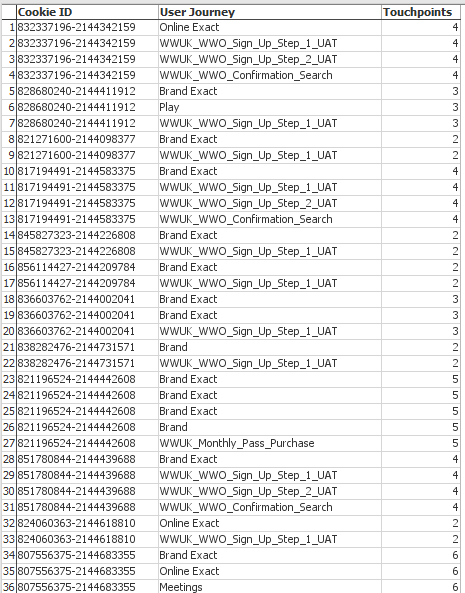
Thanks for your response. The problem with the above, is that the formula has given the total number of Cookie ID appearances per row rather than counting each one individually.
If you can let me know if there is another formula to use or a workaround that would be great.
Many thanks,
Sherrick ChavdaAttachments
2012-10-22_1139.png 53K
Welcome!
It looks like you're new here. If you want to get involved, click one of these buttons!
Categories
- All Discussions2,595
- General680
- Blog126
- Support1,177
- Ideas527
- Demos11
- Power tips72
- 3.0 preview2
Tagged
To send files privately to Visokio email support@visokio.com the files together with a brief description of the problem.


