
Bar/Line: Cumulative values plot?
-
Hi - I am trying to create an accumulative plot using Bar/Line View. Currently, the graph shows the sum amount grouped by Month Year. I am wondering if I can show the accumulative result. So, the Feb 2012 will show the sum of (Jan 2012 and Feb 2012); similarly Mar 2012 will show the sum of (Jan 2012, Feb 2012 and Mar 2012),etc.? Many thanks!
-
4 Comments
-
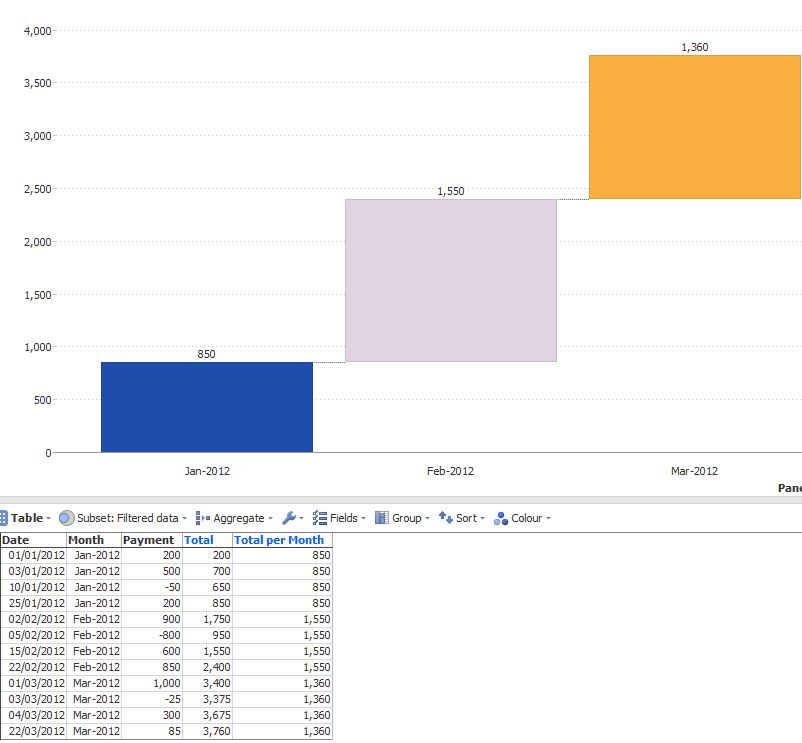
Simple file is attached to illustrate cumulative adding scenario - imagine a bank account, where daily transactions are going in and out. You wish to aggregate values per month, then show them as cumulative, and also see the monthly breakdown.
RUNNINGTOTAL([Payment])
Formula will add every new value to the existing total.
SUBSET_SUM([Payment], SUBSET([Month])) will add the values for each month.
Different nature of the values in these fields will affect choice of functions for aggregation and visualisation :
Sum - for individual Payments;
Last non-empty value for [Total] (you want to see the last balance figure in each month);
Singleton value for [Total per Month], considering they are all the same for records in one month.
Bar/Line View works well for this scenario, especially the cascading option (pictured), giving you both the cumulative value and monthly splits.AttachmentsCumulative.JPG 65K 
Bank Statement Running Total.iok 12K -
Thank you very much Paola!
The formula does sum up the numbers the way required; and it works fine in the graph too.
But, there is also a tiny flaw in applying the CLICK filter. Because the data is still grouped by single Month Year, when user clicks a bar for example Feb 2012 which shows data summary of Jan and Feb 2012; the other graph on the same tab will only show Feb 2012.
I think maybe the only way to achieve this is to hard code the data in the database.

Welcome!
It looks like you're new here. If you want to get involved, click one of these buttons!
Categories
- All Discussions2,595
- General680
- Blog126
- Support1,177
- Ideas527
- Demos11
- Power tips72
- 3.0 preview2
Tagged
To send files privately to Visokio email support@visokio.com the files together with a brief description of the problem.