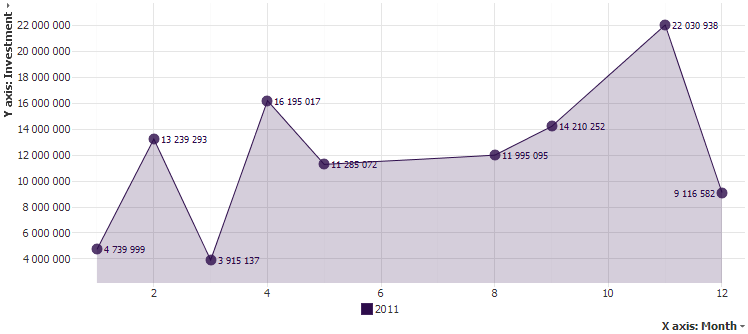
Graph View: No value as zero?
-
Hi,
I have a Graph View showing amount of investment in each month of the year. The problem is, that in several months there were no investment and therefore there is no value for these months. Individual points are connected by line (as shown on attached image). In month 6,7 and 10 there are no investments (no values respectively) but the line goes directly from month 5 to month 8, instead of going to zero in 6 and 7. Same situation for month 10. I have ticked "Treat (no value) coordinate as zero" but it seems it has no effect...
BTW, filling missing months with value 0 into dataset manually is not an option, because I would have to do that for each possible combination of filters.
Thanks for advice, MichalAttachments
Nový obrázek (7).png 18K Michal Charvat | Mindshare | Business Planning | www.mindshare.cz | www.mindshareworld.com -
2 Comments
-
You can use Bar/Line View instead. Under Measures menu, Other options (little triangle next to your selected measure), you will have option to
a) join markers
b) go to 0
c) break the line
This view is also useful if you wish to compare several lines, in which case you use Lines as layered measures.
Welcome!
It looks like you're new here. If you want to get involved, click one of these buttons!
Categories
- All Discussions2,595
- General680
- Blog126
- Support1,177
- Ideas527
- Demos11
- Power tips72
- 3.0 preview2
Tagged
To send files privately to Visokio email support@visokio.com the files together with a brief description of the problem.


