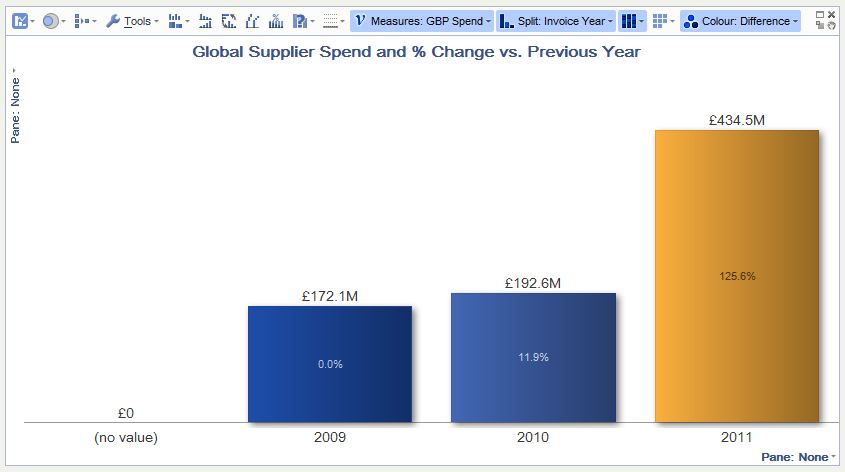
Difference Bars / Bar Comparisons
-
Hi
I have a chart and I want to see the differences between the bars. I have created a difference formula that does a subset_sum for each year and basically subtracts one from the other to get my total percentage difference and I have stacked the bars so I can see the difference within the bar (see attached). The trouble is that my subset_sum only refers to the year. The user may change one of many devices but the percentage in the bar doesn't change. Is there any way of making this more dynamic? I could make my subset formula be a subset 5 so it will be affected by more of the filters but there are many more filters than 5 and some could be all on and some selected individually.
Any ideas gratefully received.
Thanks
AndyAttachments
Capture.JPG 43K -
2 Comments
-
Currently you need to hack this up using the Aggregate menu. Choose a field that is already unique, so your data is unchanged by the transformation. For the formula field, choose "(Formula result)". The formula will be dynamically recalculated for the filtered data.
-
Welcome!
It looks like you're new here. If you want to get involved, click one of these buttons!
Categories
- All Discussions2,595
- General680
- Blog126
- Support1,177
- Ideas527
- Demos11
- Power tips72
- 3.0 preview2
To send files privately to Visokio email support@visokio.com the files together with a brief description of the problem.


