
Idea: Add Chart format?
-
Hi All - Can you please let me know if we have the attached snapshot chart format will be available in Visokio?
Regards, Rajesh BAttachments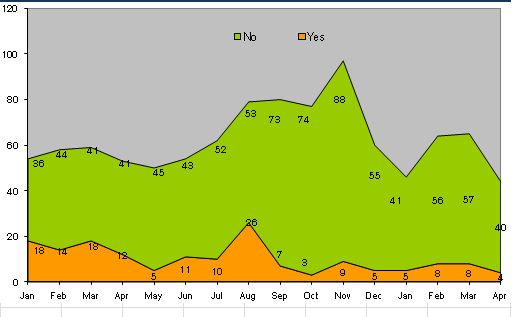
chartsample.JPG 29K -
4 Comments
-
You cannot currently do this in the new Bar/line view, however, the same can be achieved using the Graph view, using "Connect" drop down. I have attached a simple example that help illustrates this.
You may wish to adjust the alpha colouring and others settings from the options available at the bottom of the "Connect" drop down.Attachments
Example.iok 5K -
Rajesh - I would like to highlight that difference between this functionality in Excel and Omniscope is that Excel will stack up the values. Layers can, for example, represent sales of products A, B and C, and top line will represent total sales. In Omniscope this view still layers values over the same scale, so that sale values A, B, C are compared in each period, rather than added up to a total. We are considering adding this functionality in the next version, so please vote for this idea, if you want to see it added. Thanks, Paola
-
Thanks for the updates Mustafa and paola.
Mustafa,
I see your example which shows the combination of the whole months count but as I have datewise count how can I consolidate in to one, if I could have a measure option in the graph i can use the subset_sum function to get the count.
Any comments on this one please...
Regards
Rajesh B


Welcome!
It looks like you're new here. If you want to get involved, click one of these buttons!
Categories
- All Discussions2,595
- General680
- Blog126
- Support1,177
- Ideas527
- Demos11
- Power tips72
- 3.0 preview2
To send files privately to Visokio email support@visokio.com the files together with a brief description of the problem.