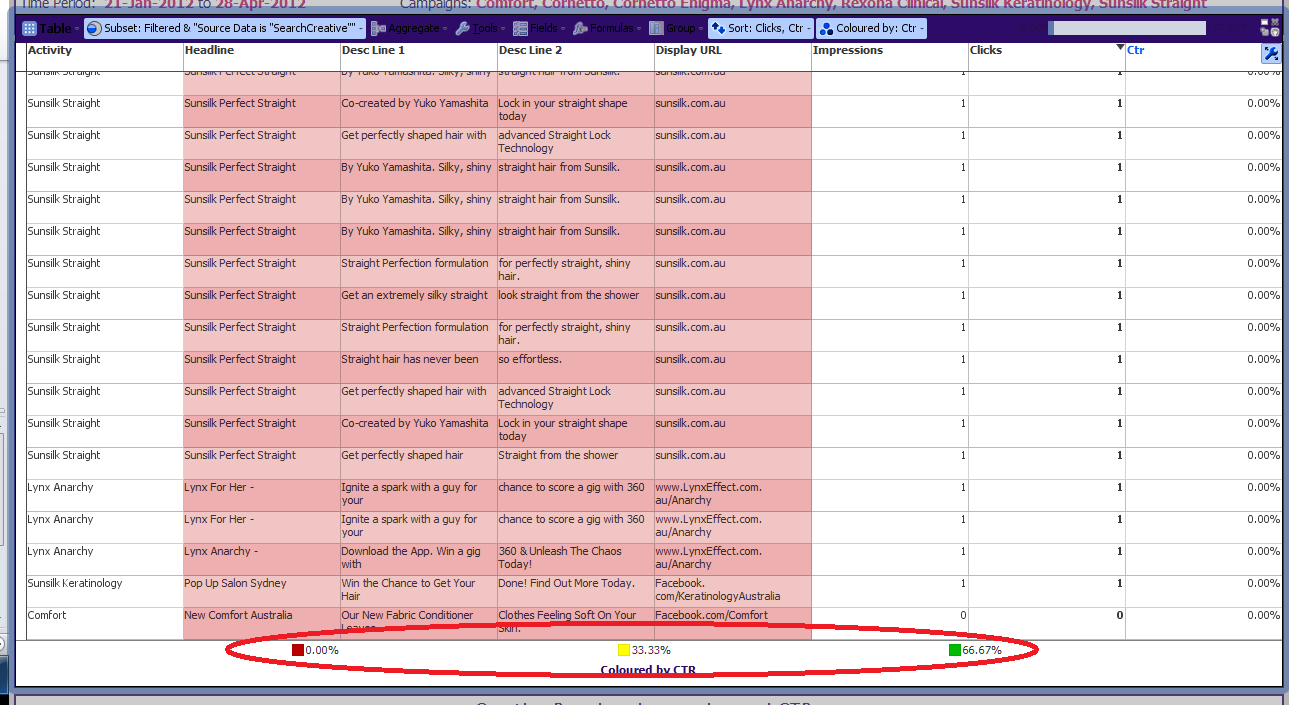
Table View: Conditional Formatting?
-
Hi - How can I change the colors and represented values (eg. in the picture below, instead of 66.67% as high, if need to set up a 10%) with conditional format in a Table View.

Thanks, Kind Regards, VijayAttachments
conditional.png 99K -
3 Comments
-
Vijay - if you want continuous shades above and below a threshold value, you can set these using:
Data > Manage fields > {field} > Options > Value colouring
If you want an 'alert' type display with values over a threshold value say, red, and values under it green, you need to add a 'bucketing' formula to categorise the continuous range of values as either above or below threshold, and then set the corresponding category colours using:
Data > Manage fields > {field} > Options > Value order, colour and shapes -
Welcome!
It looks like you're new here. If you want to get involved, click one of these buttons!
Categories
- All Discussions2,595
- General680
- Blog126
- Support1,177
- Ideas527
- Demos11
- Power tips72
- 3.0 preview2
Tagged
To send files privately to Visokio email support@visokio.com the files together with a brief description of the problem.


