
Need Independent Menu Selectors
-
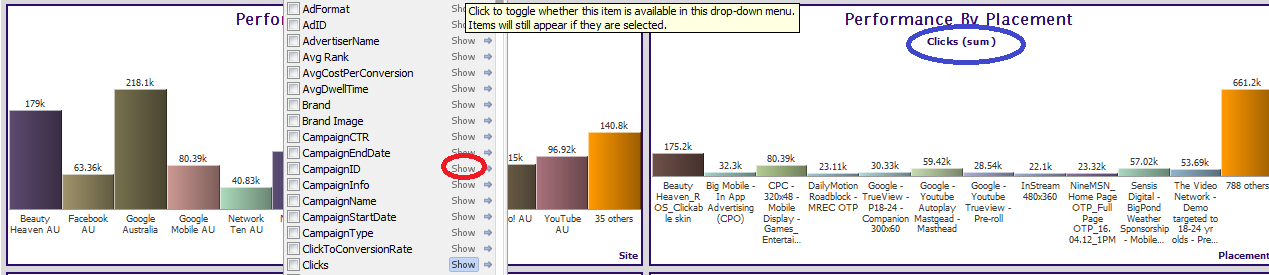
Hi - This is the problem I have been trying to find solution. When I select a metric to be shown in a menu filter (rounded with red circle) in one view, it gets added into all the views in the tab (rounded with blue circle). Same thing happens when I remove is as well. I couldn't work out out any of your suggestions regarding this issue. Could you please help me very urgently to fix this issue
 Attachments
omniscope.png 50K -
4 Comments
-
Vijay - There should be no relationship between these two options.
The view-specific drop-down menu management options govern whether or not a field appears on the drop down menu for the View, Tab or File. It allows you to hide fields for the drop down menus that users should not be able to select for a given view or views.
The view-specific Data titles options can be managed from the right-click on any data title...you can choose to display these titles Always, only When Active or Never. You can also choose to display no Data Titles from both the right-click menu and the view-specific Toolbars and Styles settings here:
View toolbar: Tools > Toolbars and Styles > Data titles
-
Hi tjbate
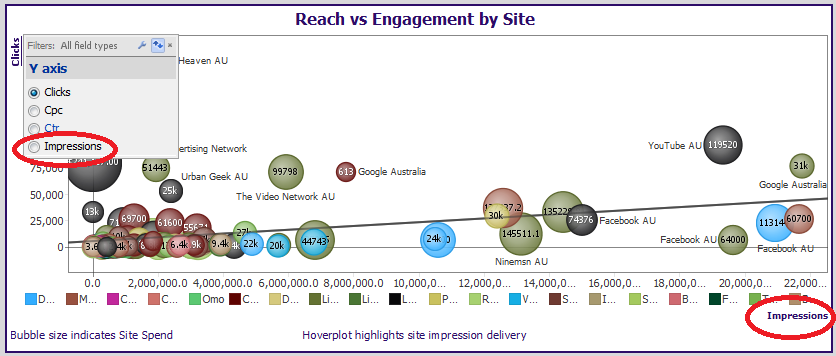
I understand your explanation regarding hiding and showing the data tiles. But as I said there is relationship between the two views. My question is how to make them independent to each other so that whenever I select a metric to be shown in the data tile drop down in one view, it does not get selected in other view. Some thing worse than this is when I am selecting the metrics in the graph view. The metrics that I select to be shown in the x-axis also gets selected in the y-axis. In the attached example, I need to compare reach vs engagement metrics. Reach metric along x-axis and engagement metrics along y-axis. But when I select Impressions to be shown on the x-axis, that metrics also appears on the drop down selectors in y-axis. If I remove Impressions from y-axis, it gets removed in the x-axis as well. I need to give the user the opportunity to compare 2 reach metrics on the x-axis vs 3-engagement metrics on the y-axis. But I am not able to get it right because of the duplication. This is the problem I have been facing and I am not able to get a proper solution for this. Could you please help me fix this. Thanks
Regards
VijayAttachmentsreachvsengagement.png 82K -
Vijay's right, this is current intended behaviour. We made the assumption that the settings for field availability in menus are tied to the type of drop-down and the type of view, not the instance.
So you can't configure two Bar views to have different field choices inside the split menu, for example.
And you can't configure the X and Y axis drop-downs within the same view to have different field choices, either.
The feature was intended to remove fields which are for internal use, such as lat/lon fields used for map coordinates. But we can see why you would need this in this case.
This reason for the current behaviour was to balance power with simplicity. If we allowed you to configure field availability separately in every single drop-down, you would then need to repeatedly configure far more drop-down menus and would need more complex controls for replicating menu customisations across different instances.
I have reclassified this as an idea. Please vote. I'll post a workaround shortly. -
Workaround (this example is for the graph view):
- Create a choice variable (Data > Formulas > Add/edit variables > Add variable > Text choice) for each axis, identifying the fields you want to make available for that axis. Use the field names as the choices, exactly.
- Create a formula field (Data > Formulas > Add formula field) for each axis, using the formula "REFVAL([var])", replacing "var" with the name of your variable.
- Configure your view to use these two fields as the axis fields
- Hide the axis data titles altogether
- The variables will appear in the sidebar as radio buttons; use these to change the axes of the view.
- Create a choice variable (Data > Formulas > Add/edit variables > Add variable > Text choice) for each axis, identifying the fields you want to make available for that axis. Use the field names as the choices, exactly.


Welcome!
It looks like you're new here. If you want to get involved, click one of these buttons!
Categories
- All Discussions2,595
- General680
- Blog126
- Support1,177
- Ideas527
- Demos11
- Power tips72
- 3.0 preview2
To send files privately to Visokio email support@visokio.com the files together with a brief description of the problem.