Coloring stacked bar chart
-
Hi,
I need a little help.
I have a stacked bar chart showing adspend. It is splitted by years and stacked by advertisers. Advertisers number reaches 80-90 by years, so I made Omniscope to show only the top 9 advertisers in detail and the others together.
I'd like to use special coloring in case of the top 9 advertisers, I mean I'd like to color their bars into corporate color. Is there any possibility to do it?
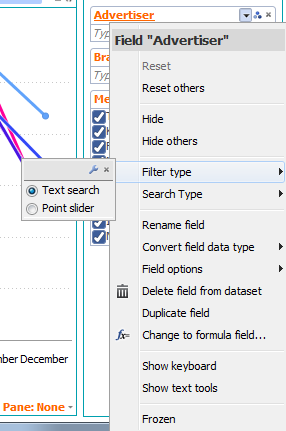
As I have a lot of advertisers, the filter type is restricted to 'text search' and 'point slider', and I can not change it to list of categories which would allow me to use those colors which I need.
Could you please help me?
Thanks in advance!
Best Regards,
Zoltan -
6 Comments
-
Hi Zoltan,
You can assign corporate colors to the advertisers from the menu option "Data>Manage Fields>" and then selecting "Options>Value order, colour and shapes" for the Advertiser field. You will now get a list of values of the field, where you can pick the color corresponding to each value.
I hope this helps.
Cheers!
IndranilIndranil Datta
Invizua Limited - www.invizua.com - Dedicated to Media, Marketing Services and Market Research Organisations
M: +44 7956 470 046 | E: indranil.datta@invizua.com | Skype: indranildatta1 | LinkedIn: www.linkedin.com/in/indranildatta | Twitter: @indranildatta
Address: Studio 6, 36-42 New Inn Yard, London EC2A 3EY -
Hi Indranil,
Thanks for your kind help.
It works well in case of those fields where the number of data is not too much and I can see the data/value/name of these fields in the slidebar.
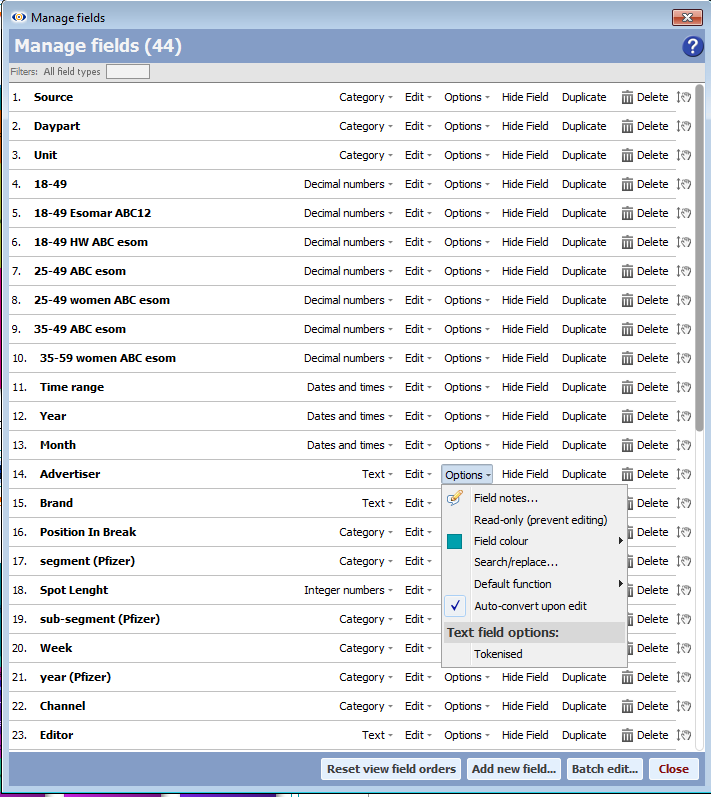
Unfortunately this is not so in my case. As the number of data under Advertiser filed is above 80-90 I can not see them detailed in the slidebar. I followed your instructions, but I could not found 'Value order, colour and shape' option. :(
Is there any possibility to change the filter type to 'list of categories', as now it is restricted to 'text search' and 'point slider'...
pls find attached some printscreens
Thanks in advance and Cheers,
ZoltanAttachments
advertiser_1.bmp 362K 
advertiser_2.bmp 2M -
Zoltan - You can colour code your advertisers by going to:
Data > Manage Fields> Advertiser (field) Options> Value order, colour, shapes
You can now select the colour for your top advertisers, and copy the same colour code for the rest from the temporary palette below the colour picker - Paola -
Under ‘Manage fields’ you will see the full list of your fields.
Next to each field name there are buttons Data type, Edit, OPTIONS, Hide Field, Duplicate, Delete.
When you click on Options, you will see a list, where 3rd one from top is ‘Value order, colours, shapes’.
This is the screen where you choose to assign certain colour to a category value e.g. advertiser A – red, advertiser B -green, and the rest – blue.
You can assign the same colour to several values and create coloured group (the ‘rest’).
With regards to the filtering – perhaps you should try creating queries, once you’re happy with filtering outcome, as they will allow you to ‘freeze’ the subset of data you’re looking at.
You can watch the video about queries (Saved queries & subsets) on our Tutorials page.
http://www.visokio.com/video-tutorials
Welcome!
It looks like you're new here. If you want to get involved, click one of these buttons!
Categories
- All Discussions2,595
- General680
- Blog126
- Support1,177
- Ideas527
- Demos11
- Power tips72
- 3.0 preview2
To send files privately to Visokio email support@visokio.com the files together with a brief description of the problem.


