
Idea: Bar/Line View -Trend lines for line graphs?
-
Hi - Can we have option for adding trend line in a line graph. Please find the attached Excel option which is highlighted with the trend line option for a line graph.Attachments
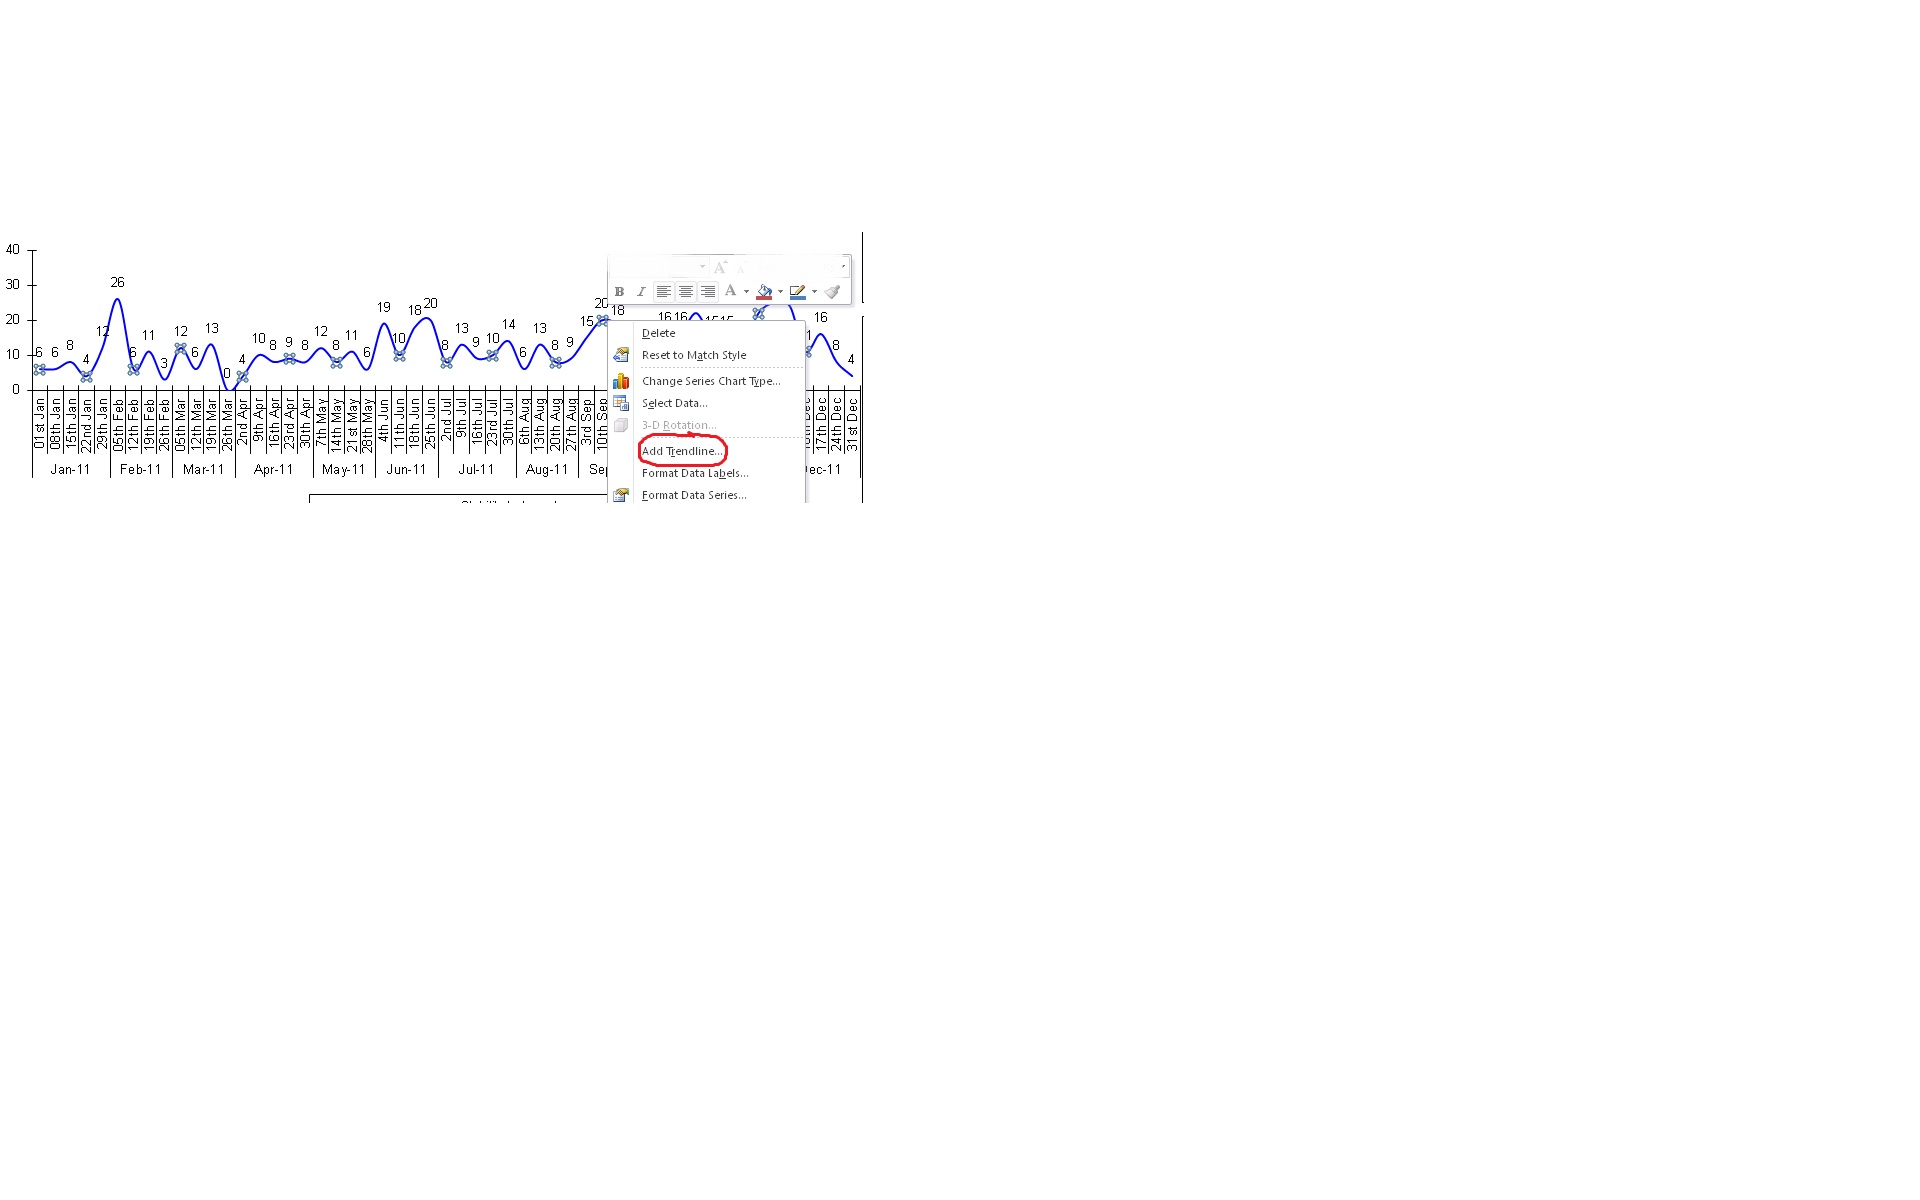
Add Trendline option.jpg 127K -
8 Comments
-
I have already added this chain with an existing one.
http://forums.visokio.com/discussion/1124 -
Hi All,
Please find the sample Iok file in which I would require to add the trend line for the blue line. I have also attached the excel file with the same data which has the trend line.
Please help me out for creating the same in Visokio.
Thanks in advance.
Regards
Rajesh BAttachments
Trendline_test.iok 192K Trendline_Test.xls 131K -
Rajesh,
I'm not sure why you're using formula measures when you just need to select "Final Global" (sum) and "Final Global-Sev" (non-empty count, after toggling "Common functions").
Regardless, see attached. While you can't add a trend line in the Bar/line view, you can achieve the same graph as seen in Excel (without the stacked bars), using a Graph view.
SteveAttachmentsTrendline_test2.iok 193K -
Hi Steve,
Thanks for the updates but can this be incorporated in the bar chart on adding the trending line which you have showed me in the graph view... This is required as the user want the bars as the number of tickets and line as the stability line trend and the trend line for the stability count.
Please let me know incase of any further clarifications.
Regards
Rajesh B -
As a stop gap, we have introduced a new formula function TRENDVALUE to 2.8 which, when calculated over the weekly-aggregated data, allows you to achieve this.
Since you want to mix stacked bars with trends of unstacked data, this must all be done in DataManager by aggregating by Week, calculating the trend line, and merging back with the original data (to keep the stacks). This means any filtering done locally won't recalculate the trend for the new subset.
I've attached the files. These comprise "Trendline_data" (your original data) and "Trendline_test3" (your original views, with a DataManager model that loads data from "Trendline_data", and adds the week trend calculation).
You should may be able to open and view the end result in earlier versions, but won't be able to refresh, or explore how it was built in DataManager, until tonight's build of 2.8.
See also the screenshot: Attachments
Trendline data.iok 8K Trendline_test3.iok 198K 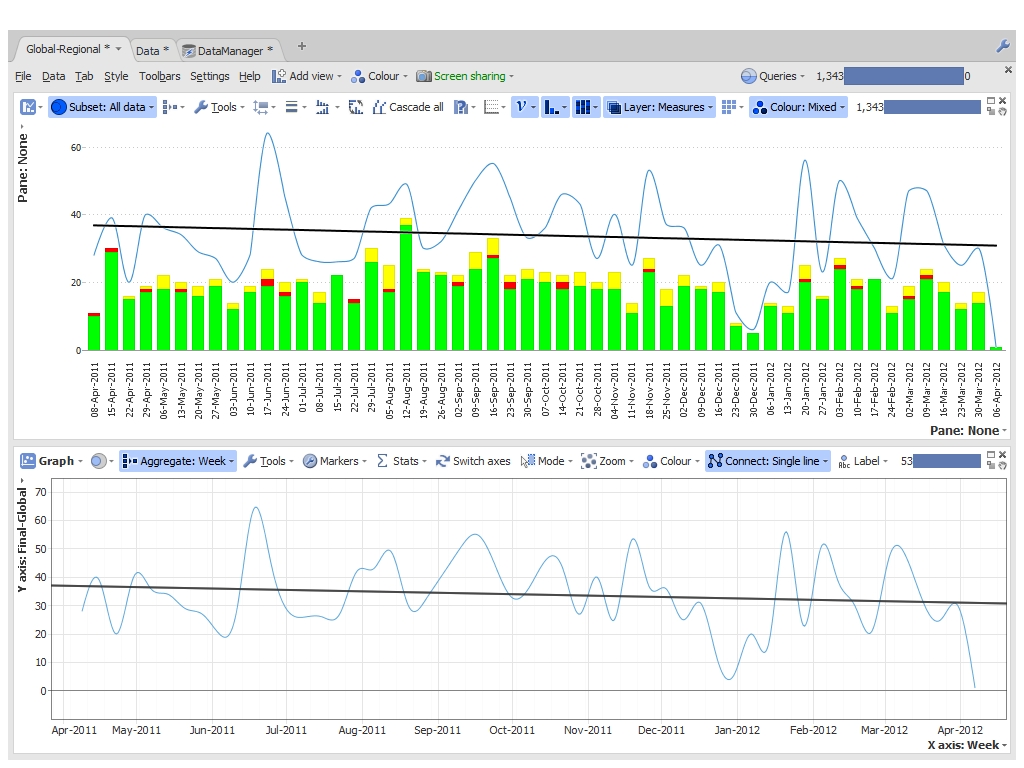
image.jpg 777K


Welcome!
It looks like you're new here. If you want to get involved, click one of these buttons!
Categories
- All Discussions2,595
- General680
- Blog126
- Support1,177
- Ideas527
- Demos11
- Power tips72
- 3.0 preview2
Tagged
To send files privately to Visokio email support@visokio.com the files together with a brief description of the problem.