
Idea: Bar/Line View - adjustable axis ranges/scales?
-
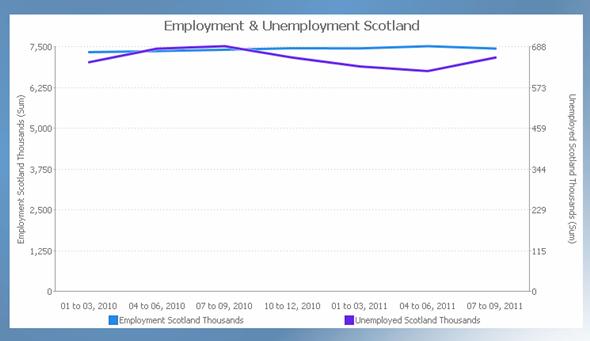
Would you please introduce the possiblility of adjusting Y axis scale in the new Bar/Line view. I'm trying to show employment and unemployment on the same chart but the movement won't be visible without tweaking the scale.
I've attached an example. - Thanks - AnnaAttachments
chart_scale_example.JPG 20K -
5 Comments
-
Have a zoom in/out or fixed scale much like you can have in graph view.Especially usesful for when your plotting two(2) graphs which you cannot do in graph view but can do in bar/graph view, scales always start from zero(0) so really hard to see relationship of line movements when plotted as scale is so wide.
Thanks
-
-
This feature has been implemented in 2.8 which is now available, click here for more information.
You will be able to fix the range by editing the minimum and maximum value in the "Custom axis range" menu under the Scale menu that is available in the Bar/Line view toolbar.


This discussion has been closed.
← All Discussions Welcome!
It looks like you're new here. If you want to get involved, click one of these buttons!
Categories
- All Discussions2,595
- General680
- Blog126
- Support1,177
- Ideas527
- Demos11
- Power tips72
- 3.0 preview2
Tagged
To send files privately to Visokio email support@visokio.com the files together with a brief description of the problem.