
Idea: Graph View - plot 3 lines without categorisation?
-
There should be a possibility to plot three lines/variables in a single Graph without having to catergorise them. The Graph View normally connects the variables only by category or by using the pivot or de-pivot option. I have data which all refers to the same category and hence it is not possible to seperate it by category. If I have 3 prices refering to the same product for the same date and I want to compare them, I should be able to do it using the Graph view.
Attached is the file of such a data.
While this can be achieved using the Bar/line View which Thomas has already suggested, the Graph view because of it ability to just plot data without actually having to join the points and the ability to have a hover plot (my data is further subdivided and not as simple as shown in the file attached) is much more useful and should have similar capabilities.Attachments
Omniscope.xlsx 15K -
4 Comments
-
The Graph view supports a scatter plot using a single field for X and a single field for Y. If you want to use different fields, as is the case in your XLSX file, the 3 fields must be depivoted (Data > Operations > De-pivot, selecting the last 3 fields), converting it to a dataset 3x as long with all values flattened into a single "Pivot values" column.
See attached.
(It isn't currently possible to do this in the Graph view without transforming your data permanently. If you wish to combine transformed data with untransformed data, see here.) -
Hi Steve,
Thank youf or the suggestion. In an attempt to get all possible views to choose from, I am also working with this option.
----------------------------
A very small query, when I am hovering over to the lines in this graph, a pink highlight comes. Could you please tell me how to remove or change the color of this?
See the attached screen shot for a better ideaAttachments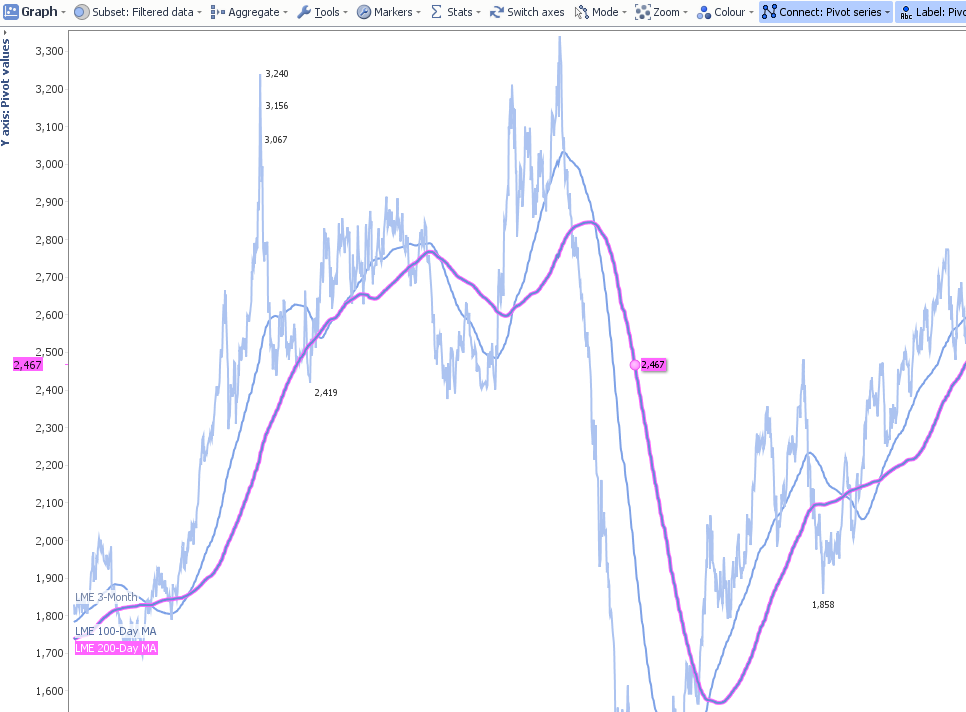
untitled.bmp 2M


Welcome!
It looks like you're new here. If you want to get involved, click one of these buttons!
Categories
- All Discussions2,595
- General680
- Blog126
- Support1,177
- Ideas527
- Demos11
- Power tips72
- 3.0 preview2
Tagged
- Bar/Line_View102
- Graph_view25
To send files privately to Visokio email support@visokio.com the files together with a brief description of the problem.