Omniscope is a very powerful visual tool for detecting and 'scrubbing' errors and making changes to your data. Once you have imported all the 'raw' data from various sources, you can use Omniscope to ensure the completeness and correctness of the data following the Data Management phase checklist [1]. Topics:
Editing Cell Values [2] - the Table View permits you to edit values in data sets at individual cell, value or column level using familiar keyboard shortcut commands
Rows & Columns [3] - adding and deleting rows and columns, setting column orders, configuring row height etc.
Dates & times [4] - specifying and changing the format of data stored in your source files as imported Omniscope date & time values.
Note: Omniscope does not currently support time durations as data values. If you are managing time durations, you must either import start & stop times & dates and let Omniscope calculate durations, or use and display durations as decimal numbers, e.g. 3.5 = 3 hours and 30 minutes
Tokenised data [5] - using data sets with more than one value (or image) per cell, i.e. one to many relationships in 'flat' data sets
Time Series [6]- Omniscope stores repeated observations over time as rows (not columns). Consult this section if you plan to create time-series displays from your data set.
Placing markers [7] - Omniscope enables you to add or edit geographic coordinates associated with a map manually. Use this approach to check your geographic coordinates, add missing coordinates, and refine the coordinate columns in your data set by referencing highly detailed online mapping resources such as Google Earth/Maps.
Data entry - see the Details View [8] to learn how this view can be configured as a data entry screen and added to any tab. Use formulae fields to set validations, and use Source IOK visualisations to 'flag' invalid inputs. Export/post edited data as corrections files/tables using web services and other methods.
WARNING: Depending on your data source(s), you may or may not be able to directly write-back or synchronise your changes with the linked source of your file, such that your changes will survive future file data refreshes (see below). In the case of direct database connections, we do not recommend writing manual changes directly back to the relational source tables. However, unless you follow an agreed manual corrections file export/import procedure, the next time you refresh your Omniscope file from its database source, some of your data edits could be replaced with the as yet uncorrected contents of the source database.
Use the DataManager workspace to specify changes to data pending correction of the data in the source databases. This will ensure that your changes are repeatly applied on each refresh/recalculation, ensuring that Reports are always correct even if the source data remains uncorrected.
To preserve data not contained or being corrected in the source database, you can divide your data set into two parts, one Source IOK file with the same fields as the database and that refreshes directly from the database, and another IOK merge file that holds your local data as edited. Following each refresh, the merge will be repeated, preserving the local data held in the IOK merge file from being overwritten by blank columns from the database refresh of the Source IOK file.
Omniscope is a powerful tool for editing the values in data sets at individual cell, value or column level. Omniscope displays cells for editing in the Table View. To edit the value in a cell, point the mouse at the cell in the place where the edit begins and double left-click on the cell and the cell will open for editing with the cursor placed where the edit begins. You can also use Right-click on cell > Edit this cell and the cell will open for editing with the cursor placed at the end of the cell.
Each Omniscope cell can contain an unlimited amount of text. Depending on the Row Height [3]selected, the cell will expand to allow you to read many lines, but you cannot scroll down within a cell. Keyboard shortcuts below are used for this and other basic editing operations within cells, and to cut and paste values between cells.
Note: it is not possible to edit cells if the file has been locked by the owner, the column has been set to Read-only, or Aggregations are being applied on the tab. If Aggregations are being applied, open another Table View and perform a Keep of the aggregated rows you wish to edit to make the aggregated records visible in the Filtered data IN data subset, and therefore editable in the non-aggregated Table View.
The following keyboard shortcuts are used used to speed editing of cells, copy & pasting values into other cells down many rows or across many columns and navigation of cells containing many lines of text:
Alt+Return adds a line return inside a cell containing text
Ctrl+A selects all the text in the cell
Delete deletes all selected text
Backspace deletes selected cells or text
Ctrl+C copies the selected cells to the clipboard
Ctrl+V pastes the values in the clipboard to the selected cells (see warning on large pastes above)
Ctrl+X removes the current values from the selected cells and stores them in the clipboard
Ctrl+Z undoes the previous edit
Ctrl+Y re-does the previous undone edit
Ctrl+; inserts the current date into the cell
Ctrl+End moves the cursor to the end/bottom of the text in the cell.
Ctrl+Home moves the cursor to the top of the text in the cell
Page Down moves the cursor a full page down the text
Page Up moves the cursor a full page up the text
Note: Macs use the Command key instead of the Ctrl key. See the full list of keyboard shortcuts [9]
You can move data into or out of Omniscope using copy and paste (assuming the file owner has not locked the file). Column headers are used to set sorting behaviour and cannot be used to select an entire column. To select most or all of a long column, hold the Shift key down and drag the right Table View scroll bar to the very bottom of the target range. Then click on the last cell in the range so that all intermediate cells will be selected and become targets for edits like copy & paste and delete.
WARNING: Be careful when pasting large, rectangular tables of values into Omniscope. If you specify a target paste range with more rows and columns than are contained in the data set you are copying, Omniscope may duplicate the records to fill the target space entirely. If you are not sure how many rows and columns you are importing via copy and paste, create a large number of new rows and columns and select only the single upper left-hand cell as the target paste range. This usually pastes the correct range. However, depending on the format/source of the incoming pasted data (web page tables, for example) all of the incoming values are sometimes pasted into the single upper left cell only. If this happens, then you must specify a rectangular target area exactly the correct size to receive the incoming pasted data. If you accidentally make the paste range too large, be sure to check for, and delete, any duplicated records.
There are two different ways to make changes to multiple values in a given field (column) such that all instances of the value are changed; either from the Options sub-menu for the corresponding field (column) in Main Toolbar: Data > Manage Fields [10], or, if the field is typed 'Category', you can edit the category values directly from Sidebar devices by right-clicking on the value you wish to edit.
A powerful search and replace option that will work with all data types is accessed from Data > Manage fields > {column} Options > Replace within values
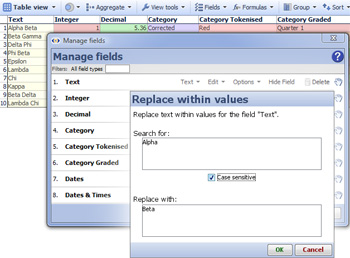 | Replace within values - this option is not global, it only operates on the specified field (column) to search and replace full or partial matches automatically. Use this tool, for example, when date formats are not consistent within a given column, and the data format needs to be made consistent before Omniscope can apply Date & Time typing. You can use this tool with Text, Category, Numeric and Date & Time data. |
If the value to be edited is in a column typed Category, you will also see an editing option from Data > Manage fields > {column} Options > Value Order,...> Edit Value as shown below:
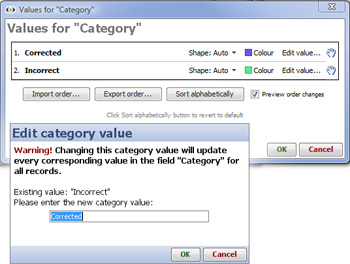 | The Manage fields > {column} Options > Value Order..., dialog enables you to change the sort order, colour and shape assigned to each Category value in the column (see below), as well as edit the values and their sort order: Edit value - replaces the selected category value with the specified text for all rows in the specified field (column). Once you have corrected all values in the Category column, use the 'hands' to change the sort order by dragging values upwards or downwards. This top-to-bottom sort order will be used throughout the file, for example in the Sidebar category filter devices, etc. You can export and import long sort orders e.g. bond ratings as text files and revert to the default alphabetical sort order at any time. Ticked by default, the Preview order changes option allows you to see the effect of order changes immediately.
|
Specific values in a category field (column) can also be edited collectively directly from the Sidebar, as can the colour and shape assigned to each category value:
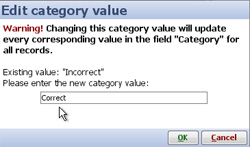
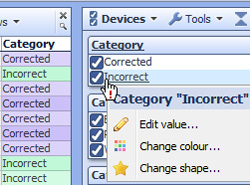 | Right-clicking on the value to be edited displays a drop-down menu from which the value can be edited, as well as the colour and shape assigned to the value changed. Clicking on Edit Value will display a warning and a field where you can enter the corrected value for rows whose column values you wish to change.
|
Because Omniscope has features of both databases and spreadsheets, the terms 'columns' and 'fields' are interchangeable, as are the terms 'records' and 'rows'. Omniscope imports tabular data sets which are structured into fields (columns) and records (rows). The default opening Table View provides a traditional, tabular 'row and column' view of the data set in the file. Current versions of Omniscope assemble all imported and merged data into only a single table, but future versions will be multi-table.
You can add fields and add and delete records from various menus, depending on the degree of control you need an where the records appear in the data set.
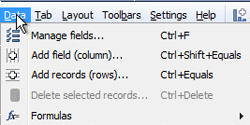 | Add field (column) - adds a new named column to the data set at the far right of the columns in that Table View, and the bottom of the list in Manage fields. Add records (rows) - adds a specified number of blank records to the bottom of the data set display. Delete selected records - displays warning asking if you want to permanently delete the records currently selected. |
The left-most, unlabelled, narrow column in the Table View is the Row Header. Left-clicking on the Row Header selects that record. Hold down the Ctrl key and you can select any pattern of rows. Double-clicking on a Row Header displays the Details for that record according to the Details display settings available from Main Toolbar: Settings > Details. Right-clicking on a Row Header, or selected group of Row Headers, displays options for adding, deleting and duplicating rows:
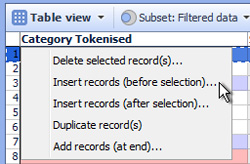 | Delete selected records - displays warning asking if you want to permanently delete the records currently selected. |
Note: When adding or deleting rows, make sure that the Table View you are using is displaying either the default Filtered data (IN) subset with no records filtered out, or better yet the All data subset. This ensures that the new records (rows) are not subjected to filtering and named Query settings until fully populated.
You can change the ways rows are displayed from the Table View: View Tools > Row options menu:
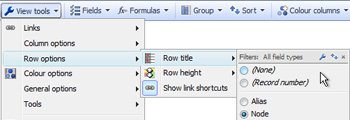 | Row title - by default, Omniscope displays a record number in the Row Header sequenced as in the data source. You can save space by selecting (None), or choose to substitute this with values from a column in the data set (usually one with complete and unique values), which can then be hidden |
Show link shortcuts - by default, the far right end of each row displays a links menu providing links related to the record, a list of pre-configured links that may suit some fields in the record, and options to create both local and web links. If no links are configured in the file, only the Details link will display. You can choose to hide the link shortcuts in any given view by toggling the Show link shortcuts option. See Creating links [11]for more detail.
The Add new field button at the bottom of the Data > Manage fields [10]dialog enables you to name and add a new filed, but you must then drag the column into the correct column order. New fields are typed 'Text' by default
You can also right-click on a Column Header to access many column-related commands with more control over the placement relative to existing column orders:
 | Right-click {Column Header} > Tools: |
Delete field from data set - after a warning, permanently deletes the column from the data set. This is a remembered action that will be repeated on each refresh.
WARNING: Be careful when clicking on Column Headers. Unlike spreadsheets, a left click on a Column Header in Omniscope sets a Sort...see Setting & Clearing Sorts)
To select most or all of a long column, after selecting the first cell, hold the Shift key down and drag the right side Table View scroll bar to the bottom of the target range. Then click on the last cell in the range so that all intermediate cells will be selected and become targets for edits like copy & paste and delete.
Omniscope makes use of repeated observations over time in vertical rows, rather than the horizontal column layouts often used to lay out spreadsheets. To create a multi-line time series in Omniscope, put your data in a 'vertical' format like that illustrated below, where each successive record in the data file is a price observation for a company's shares at a different point in time:
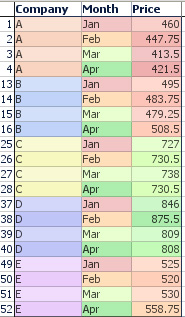 | In this example of a time series, we have 5 companies "A" to "E" with historic share prices for each month. The Company field contains Category values correlating to different lines in the time series. Let's call this our Category field. The Month field contains Date and Time values representing the time part of the time series, along the X axis. Let's call this our Time field. The Price field contains quantitative Decimal number values for the Y axis. Let's call this our Value field. Don't worry about the vertical repetition in the data...this will be invisible in all views except the Table View and not evident in the time series reports you configure. |
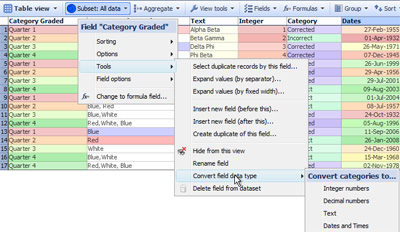
Check your data types - After importing your data, make sure the Time (here Month) and Value (here Price) fields are the correct format. They must be numeric (decimal or integer), or dates, shown by the red to green colour gradation. Also make sure the Category field is of type Category, shown by the variety of different colours. You can convert data from one type to the other by right-clicking the column header in the Table View and choosing Convert field data type.
Sometimes time series source data is laid out horizontally (repeated observations in columns) when Omniscope would manage it better vertically. In other cases, data may need to be exported from Omniscope in an orientation different from that used in the Omniscope file. To avoid the time consuming process of changing the orientation of some or all of the data from horizontal to vertical (row becomes column) or vertical to horizontal (column becomes row), Omniscope has both De-pivot and Re-pivot functions. Use of these functions is discussed here [12].
For a continuation on displaying line graphs like time series, see the the Graph View section displaying time series [13].
You can use embedded vector maps or online Google Maps from within Omniscope to add map coordinates to your data by selecting records (rows) and manually placing markers on an open Map View.
To place markers and automatically generate coordinates in your data for existing records (rows), open your data set and close all open views except:
These views must be open simultaneously, and you might want to drag or switch (rotate) the view divider to allocate more space to the Map View. When you add the Map View, if this is the first time you're adding markers to the map, you will see the Configure Map dialog asking you to configure the map:
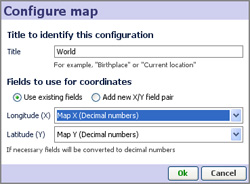
Make sure Add new X/Y field pair is selected, and click OK. You will be able to name the new. blank coordinate fields in the dialog.
Suggestion: name the X-axis with something related to longitude and the Y-axis with something related to latittude.
Next, filter your data until only the records you want to place to generate coordinates remain visible. For example, if you have already placed some markers, you will want to filter out the records that already have coordinates. This will make focusing on the remaining records with blank coordinates easier. In the Omniscope Table view, scroll across to the coordinate fields, and click on any grey (blank) cell. This will select all the records without coordinates. Click Keep on the Main Toolbar to isolate only those records in the Table View.
In the Map View, first make sure Place marker mode is selected in the mouse Mode drop-down.
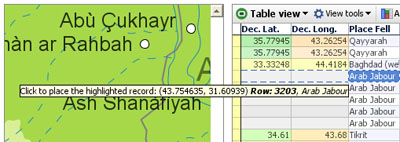
Notice that the X and Y coordinate fields visible in the Table View are populated automatically with latitude and longitude coordinates when you do this.
Sometimes you might want to place a range of records at a single point on the map. For example, you might have a database of customers, and you might only know they are based in London. In the Table or Chart Views, select the records you want to place in the same location. In our example, there might be a field called 'Location'. In the Chart View, we would open the Location device and select the value 'London'. In the Map View again, still in Place marker mode, point at London and click to place all selected markers in London.
After zooming in and exploring your map and markers, you might want to adjust the position of some of them. In Place marker mode, dragging a marker will update its position. If the marker represents several records, only the top-most record in the "pile" will be repositioned.
When in Place marker mode, if you click on the map without record(s) selected/highlighted, you will be asked if you want to Add a record at that location. This will create a new record (row) in the data set, with all fields empty except the coordinates.
Links:
[1] http://kb.visokio.com/data-mgt-phase
[2] http://kb.visokio.com/editing-cell-values
[3] http://kb.visokio.com/rows-and-columns
[4] http://kb.visokio.com/dates-and-times
[5] http://kb.visokio.com/tokenized-data
[6] http://kb.visokio.com/time-series-layout
[7] http://kb.visokio.com/place-markers
[8] http://kb.visokio.com/details-view
[9] http://kb.visokio.com/shortcuts
[10] http://kb.visokio.com/manage-fields
[11] http://kb.visokio.com/create-links
[12] http://kb.visokio.com/node/339
[13] http://kb.visokio.com/display-time-series