Once you are satisfied with the content of your data set, you are ready for the next phase of file preparation following the Visualisation Phase checklist [1].
Selection
Filtering
Queries & Subsets [2]- Introduces the related concepts of Named Queries and defined data subsets. The Main Toolbar Named Queries menu options are covered, as is the Data Subsets selector that appears on most View Toolbars immediately to the right of the view name for all views.
Aggregation [3] -
Using an activated Omniscope, you can add a new view to a tab, or change a view from one view type to another, at any time using the Maintoolbar: Add View icon drop down to dislay the View Chooser, or clicking on the far left view icon on any view toolbar, which also displays the View Chooser
Applies to verison 2.4 only;
Omniscope 2.4 offered 14 different views, but version 2.5 has expanded this to 16, with the former Tree View being replaced by the new Network View. You can use these views in any combination to help you and recipients of your files analyse and illustrate the messages in your data. Omniscope views offer much more than just data visualisation and portable/exportable charting and presentation. Most views are complete data navigation environments enabling browsing, aggregation, analysis, filtering and drill-down to details. All views set to show the same data subset/named query e.g. 'Filtered data (IN)' or 'Errors for Correction' update simultaneously to reflect filtering actions.
![]() on the Main Toolbar displays the vertical View Chooser drop-down menu. The same display can be use to change a view window from one view to another by clicking on the left-corner view icon on the View Toolbar. On the View Chooser, each View is represented by its own icon:
on the Main Toolbar displays the vertical View Chooser drop-down menu. The same display can be use to change a view window from one view to another by clicking on the left-corner view icon on the View Toolbar. On the View Chooser, each View is represented by its own icon:
Click on the view icons above or the names below to go directly to the discussion of each individual view:
|
*To see the experimental views available in your version, tick this advanced option, then re-start your Omniscope:
Version 2.4: Tools > Advanced Tools > Application wide settings > Show experimental features;
Version 2.5: Settings > Advanced > Show experimental features.
Some of the views are slightly different:
Web View [16] - opens browser window(s) showing linked web pages and the results of web services associated with the data set.
Content View [17] - displays free text commentary and links to web assets, including images and charts not referenced in the data set
Dial View [18] - creates typical dashboard-style gauges to display field (column) composition, progress and alert conditions, etc.
Details View [19] - displays all (non-hidden) values for each single record, together with images and buttons/links connecting to related web pages/services.
DataPlayer View [20] - allows anyone to create interactive Flash DataPlayers encapsulating the data in exportable 'dashboards' for documents and web pages.
If you wish to arrange more than one view on a tab, you can control the amount of space and the order of each view.
Immediately to the right of the Help command is the Add View drop down menu, used to add an additional view to the current display. To remove a view from the display, click on the [X] in the upper right hand corner of the view. To change a window from one view to another, click on the view name and select the view you want from the drop-down menu. If you want to add a view showing another data subset, you can select it using the Data Subset drop-down to the right of the view name in each View Toolbar.There is no upper limit on the number of views you can open in Omniscope, but display screen size limitations encourage using multiple tabs to display different combinations of views, rather than crowding the working display with too many open views.
Hint: It is best to first create a layout of view windows the right size and shape for each view, then switch each window to be the desired View. Easier than Rubik's Cube!
In addition to the Main Toolbar barometer, many views display view-specific barometers whenever they are displaying a data subset different form the Filtered (IN) subset.
Options for each view are generally available on the View Toolbar. Many of the commands available from the View Toolbar > View Tools drop-down menu are common to all views. Commands or options common to all (or most) views are documented here: View Tools common commands [33].
Applies to version 2.4 and prior
Each View has a View Toolbar, which presents the features and options applicable to that View, including a View Chooser, Data Sub-Set selector, Aggregation options, a View tools drop-down menu, Fields (columns) picker and other options specific to each view. View Toolbars open and close at the top of each view window. All views and View Toolbars always open below the Main Toolbar, whose commands apply to all open views.
View Toolbars vary in appearance, since each View features different controls on the toolbar, but they typically look like this:
![]() [update to 2.4]
[update to 2.4]
In the left corner of each View Toolbar is the View icon which identifies the view currently selected. Clicking this icon also reveals the vertical View Chooser drop-down from which you can change the view shown in that window. On the right-most end of all View Toolbars is the Close View icon, shown as a black [X]. Click this icon to close the view. You can always bring closed views (or new, additional views) back by clicking this icon on the Main Toolbar:
By default, new views will open with the Data Subset selector set to 'Filtered data (IN)' meaning you're looking at all the records that meet the filtering criteria expressed on the Side Bar. You can change the Query/Subset of the data shown in the view using the drop-down selector. More on Queries & Subsets [2]
Beginning with version 2.4, many Views include an Aggregation drop-down menu, used to define aggregated views of the data, together with the function to be applied when aggregating each field (column). Aggregation differs from the presentational Grouping options available only in the Table View. Unlike Grouping, the end user is not meant to 'unroll' or 'drill down' the defined aggregation to the lower level of granularity. User-interactive Grouping can be used in addition to Aggregation. For example, a file with each row defined as an observation for a given day can be aggregated by week, then grouped by month and year. In the resulting Table View, an end user would be able to unroll the groupings down to weeks, but to see the maximum granularity daily data, they would have to remove the Aggregation settings.
Omniscope provides several ways for users of files to filter/query the data in the file.
The de-query option allows you to modify data subset definitions selectively to return records already filtered OUT to the filtered IN data set.
Relates only to version 2.3 and earlier. Data Universes have been reclassified as Data Subsets selectable using the Data Subset drop-down selector in each individual View Toolbar, and configured using the Queries drop-down on the Main Toolbar (2.4)
When Omniscope filters records, where do the excluded records go? Don't worry...they are not deleted! Based on your filtering decisions, Omniscope classifies each record (row) in a given file as being in one or more Data Universes:
All of these Universes can be viewed at any time in any of the 12 available views in Omniscope. Click on ![]() Add View on the Main Toolbar, then select the Show other data universes option at lower right.
Add View on the Main Toolbar, then select the Show other data universes option at lower right.
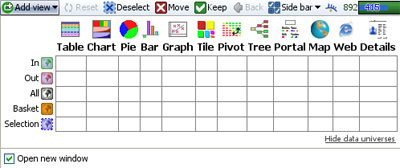
Tick the box representing any combination of Views and Universes to see the records (rows) currently in each universe in each view.
If you save an Omniscope file, the contents of the IN and OUT Universes will be preserved, and the file will open with the barometer showing the same IN/OUT split as when the file was last closed. However, the contents of the BASKET and SELECTION Universes will be re-set. Always remember to do something with the contents of your BASKET universe before you close the file, because this selection of records will not be there when you open the file again.
Let's explore the use of Data Universes in Omniscope, while re-visiting the filtering aspects of navigating .IOK files. Recall that there are 2 filtering approaches in Omniscope, which can be used interchangeably at any time, assuming at least one SideBar with instant filter/query devices is showing.:
For this tutorial, please download another, especially-configured version of the Everton Football Universes [34] file. This version of the Everton file has been configured to open with five Table Views, one for each Universe, and with only one Side Bar open:
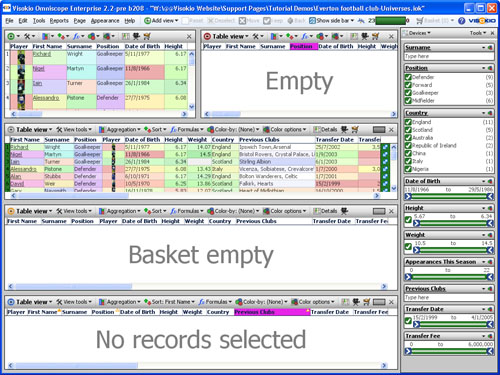
The View icons on the far left of each View Toolbar are coloured to show which of the 5 Universes is being displayed in the view. In this demo, the upper left-hand Table View is showing the green IN Universe, all 23 players. The upper right-hand Table View is showing the red OUT Universe, currently empty because no players have been filtered out. The full-width black ALL Universe Table View in the middle will always show all players, regardless of filtering. The gold BASKET Universe Table View is showing 'Basket Empty', since no players have yet been placed in the Basket. Finally, the bottom blue SELECTION Table View is empty, indicating that no records are yet selected.
Using the Side Bar, type the letter 'B' into the top text query device labelled Surname. Notice how the right-hand green IN Table View changes to display only the 3 players whose surnames begin with B, and the left-hand red OUT Table View now displays the records for the 20 players whose surname does not begin with 'B'. A glance at the barometer confirms that the green IN Universe contains 3 players whose surnames begin with B, and the red OUT Universe contains 20 players whose surnames all begin with other letters. In the Side Bar, back-space over the letter 'B' to clear the Surname query device, which will Reset the file, since this was the only extant query/filter setting.
Notice that when using the Sidebar devices, the bottom Table View showing the SELECTION Universe did not show any records being selected, and that moving 20 players to the OUT Universe was instant.
Now let's try using Selection, which can be very useful for drilling-down and confirming details before deciding whether to execute a Move or Keep operation.
Go to the upper right green Table View showing the IN Universe, and click on the Position category Defender, which will display an animated highlight in blue. This means you have selected all the players who are Defenders, and their records will now appear in the bottom blue SELECTION Table View. A glance at the barometer will confirm that you have selected 9 Defenders out of the 23 on the team.
Let's say you want to take a closer look at the Defenders. On the main/top Omniscope Toolbar, click on the green check-marked icon labelled Keep. This will keep only Defenders in the green IN Universe and move all others to the red OUT Table View to the right. Notice that the SELECTION Table View has been cleared, pending you next selection.
Let's say you want to put all the English Defenders on the transfer market (don't ask...). In the Sidebar, using the 3rd device labelled Country, click on the category name England. Notice that all other nationalities are X-ed out and all non-English Defenders are moved to the red OUT universe, leaving only the 4 English Defenders remaining in the IN Universe. Now go to the green IN Table View Toolbar, and find the Add to Basket icon right-most on the toolbar. Click the Add to Basket icon, and notice that the gold Table View showing the BASKET Universe now shows the 4 English Defenders.
Click Reset on the Omniscope Main Toolbar. This will return all players to the IN Universe, and empty the OUT universe, but leaves the 4 English defenders in the Basket, as can be seen also on the top/main Omniscope Toolbar Basket icon to the right of the barometer.
Let's save the youngest English Defender for the future. In the gold Table View showing the 4 English Defenders currently in the BASKET Universe, click on the column header Date of Birth. This will set a primary sort (see the orange downward arrow appear in the column header) sorting the players in the basket from youngest to oldest. Double-click on the row header of the youngest player, Daniel Fox. This will display the details window pop-up for Daniel Fox. Now click Remove from Basket to remove Daniel's record from the basket.
To clear the BASKET Universe completely, click on the right-most Clear basket icon in the gold Table View Toolbar, or use the Omniscope Main Toolbar Basket > Clear basket command on the drop-down menu. More on Using the Basket... [35]
Refers to version 2.3 and earlier. From Omniscope 2.4, the basket universe has been superceded by Named Queries [2] which are far more powerful. The terminology "Data universes" has also been dropped. Using Named Queries, multiple baskets can be used.
Omniscope classifies every record in the data set as belonging to various 'data universes'. In addition to being in either the IN or OUT Universe, all records are always in the ALL universe. At any given time, any selected records are in the SELECTION universe. Clicking ![]() Deselect, or executing a power query using
Deselect, or executing a power query using ![]() Move or
Move or ![]() Keep removes all records from the SELECTION universe and shifts records between the IN and OUT universes. Clicking
Keep removes all records from the SELECTION universe and shifts records between the IN and OUT universes. Clicking ![]() Reset moves all records from the OUT universe back to the IN universe.
Reset moves all records from the OUT universe back to the IN universe.
Version 2.3 and previous: Every View Toolbar (except the Web View) allows you to put all (or just one or more selected) records into the BASKET universe, building up a list of records in which you are particularly interested. The purpose of the BASKET universe is to allow you to collect a session-persistent subset of records (rows) that does not Reset. The Basket allows you to use many different Side Bar filter criteria or sequences of power queries to identify records of interest, placing each group of records in the BASKET for 'safekeeping' prior to executing a Reset and applying other filtering sequences or power queries to your data.
Although records in the BASKET are unaffected by Resets, the contents of the BASKET not saved on Exit. If you wish to save, share or reuse the contents of the BASKET, you must use the Export or Import basket references (or images) command options which appear on the View Toolbar whenever you are viewing the BASKET target universe:
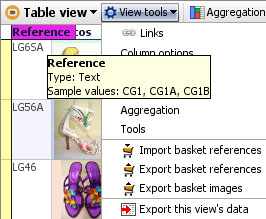
References are the values in a field (column) that are unique, that is, there is only one reference value for each record (row). (You should always test for duplicate references using the Table View Tools Tools > Select duplicate values option )
Import basket references- if you or someone else using data with the same unique identifiers have previously saved a reference list as the single column of values in a .TXT file, you can re-create the contents of the BASKET in your current Omniscope session using this command to import the external .TXT reference file. Omniscope will move all matching records (rows) into the BASKET universe automatically, and tell you if any references in the external file could not be matched.
Export basket references- typically, you use Side Bar filtering and power queries (together with geographic and image-based selection) to identify a sub-set of records on interest, and accumulate them in the BASKET universe. Before you exit, if you want to save (to share or re-use/re-create) the contents of the BASKET, you must use this command to export a .TXT file containing a list of the references currently in the BASKET.
Export basket images- Omniscope can be used to manage and select images grouped in folders (image sets) for web-sites, DataPlayers, and other uses. At any time, a selection of images in the BASKET can be exported as a new image folder using this command.
Export this view's data- used to export the entire contents of the BASKET universe in various file formats ( .IOK/.IOM, .XLS, .CSV, .TSV, .XML, etc.) using the Export Data wizard [36].
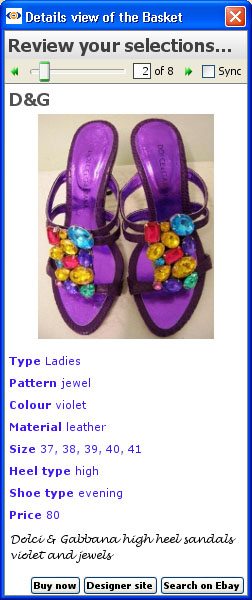
You can enable your users to browse the contents of the BASKET in any view(s), but given that they will have already selected these records and placed them in the basket for closer review, a free-floating instance of the Details View with the records navigation slider revealed can be the most effective.
To create a free-floating view, use ![]() Add View command on the Main Toolbar with the Open new window option ticked. From the Details View Toolbar, choose Show navigation controls to display the arrows and slider navigation at the top, and untick the Sync option, since this view is for user review of the BASKET universe only. Add a title, use the Links option to add buttons for the action links at the bottom, then hide the View Toolbar and users will be able to interact with their baskets record-by-record using a floating window something like this:
Add View command on the Main Toolbar with the Open new window option ticked. From the Details View Toolbar, choose Show navigation controls to display the arrows and slider navigation at the top, and untick the Sync option, since this view is for user review of the BASKET universe only. Add a title, use the Links option to add buttons for the action links at the bottom, then hide the View Toolbar and users will be able to interact with their baskets record-by-record using a floating window something like this:
Omniscope allows you or your user to define a subset of Selected rows at any time, and from any view, usually just by using your mouse.
{update to version 2.5 in progress...}
The sidebars are used to display filter/query devices and other options on either the right or left-hand side (or both) depending on the tab-specific settings on the Main Toolbar: Toolbars options, which manage the display of the sidebars.
[2.5 Main Toolbar: Toolbars menu commands]
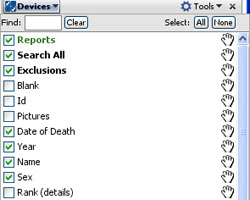
Whenever either Side Bar opens, there are three menus displayed at the top; the Devices drop-down menu, the Tools drop-down menu, and the right corner [X] to close the Side Bar. The first time the Side Bar opens, three configurable display options (Reports, Search All, and Exclusions) plus filter devices for all fields (columns) in the data set will be ticked and therefore visible on the Side Bar.
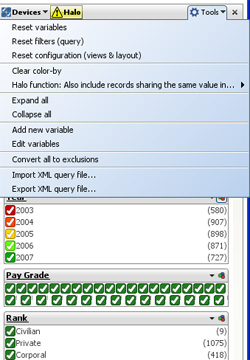
To configure or re-configure the Side Bar, click on the Devices drop-down menu on the upper left:

Except in a general 'Data Set' tab intended to show everything, you will probably not want filter devices for ALL the fields (columns) to be displayed on most pages. Some field values may not be relevant to the message or useful for selecting/filtering the displays on a given page. Use the Devices drop-down menu to untick those fields to hide their filter devices. Use the drag hands at the right to move filter devices up-wards or down-wards to achieve the desired display on the Sidebar. You can also move the filter devices themselves into a new order by dragging and dropping them with the mouse up-wards or down-wards on the Sidebar.
The three configuration options at the top of the Devices list (Reports, Search All and Exclusions ) will be displayed on the Sidebar only if you leave them ticked. Otherwise, untick these boxes and Report Page tabs will display across the top of the Main Toolbar (the default), Exclusions (Move and Keep with history) will show on the Main Toolbar (without history), and Search All will be available in the Portal View [13], when open.
Note: Side Bar settings are specific to each Reports Page, and must be changed page-by-page inside Reports Mode. Side Bar settings established outside Reports Mode (always hit Escape to make sure you are not working in a specific Report tab) will apply outside Reports Mode. If you create one or more Report Pages, you can either keep your existing Side Bar settings the same or change them to suit each Report Page. More on creating Report Pages. [37]
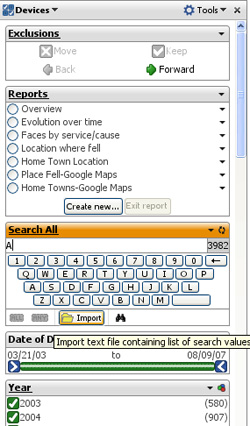
If you leave all three display configuration options ticked, the top of your Sidebar will look something like this:

Displaying Exclusions on the Sidebar has the advantage that you can expand the Exclusions device and monitor the history of your Moves and Keeps (see image below). This is especially useful when you are recording a power query sequence of ![]() Moves and
Moves and ![]() Keeps to send to someone else as a query file for use with their copy of the file (see below for more on query files).
Keeps to send to someone else as a query file for use with their copy of the file (see below for more on query files).
Displaying Reports on the Sidebar is useful when there are very few, or when there are many Report Pages that need to be arranged in groupings.
Like Search All above, any Sidebar text filter can be expanded to reveal a virtual keyboard for text search entry, with ANY and ALL multi-term search options. Omniscope text search works like a search engine, on one, several or all fields (columns)simultaneously. In any text filter, if you enter a single text string with no spaces, Omniscope will perform a prefix match, highlighting all records with text beginning with the search string. If you enter two text strings separated by a space and do not enclose them in "double quotes", you can search a field (column) of the data file for either one or both of the strings using the ANY or ALL search options. You can expand your search criteria to include values in other columns by simultaneously entering text strings in more that one filter device. To the right of each device you will see the hits in that column and at the top, in the barometer will show the combined record count.
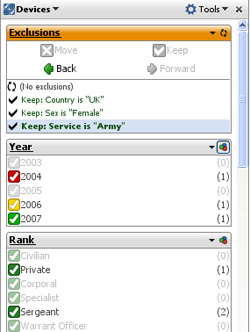
Notice that whenever a query device is actively filtering the data set, the device panel colour turns orange:

Closing the Sidebar with filters set will prompt a message either to reset all the filters, or to convert the query settings to Exclusions. If you wish to keep the same record set in the IN Universe with the Side Bar closed, you must choose Convert to Exclusions, which means that the filter settings will be translated to the equivalent ![]() Moves and
Moves and ![]() Keeps that you can manage directly in the open views without the Sidebar.
Keeps that you can manage directly in the open views without the Sidebar.
The Sidebar Tools drop down menu displays commands that affect the data and/or all other Sidebar query devices. The first three of these are especially useful when managing the creation of Report Pages and using them in live presentations.
 | Reset variables- Variables are input values not contained in a column of the data set that you can include in formula fields to facilitate dynamic modelling and sensitivity analysis. When you specify a Variable, you define a minimum, maximum and a default value in the range. Each variable defined in a file can display a Sidebar slider enabling users to change the assumed value. Clicking on Reset variables returns all variables to their default values. For more on defining and using variables, see Formulas & Variables [38]. |
Reset configuration (views & layout) - returns the current view to a 'pristine' state, with all views closed and the Sidebar reset to opening default settings. Usually used to recover from confusing combinations of views and layout when constructing Report Pages.
Clear colour-by - each device has a small colour-by icon in the upper left. Clicking the device icon imposes the colouring scheme for that field (column) on all the open views that use colouring, like the Table View, the Tree View, etc. This command removes all overriding colouring schemes that have been set in the Sidebar (but not those already specified in the individual View Toolbars)
Halo function: Also include records with the same value in: - a powerful feature for managing groupings or clusters within a data set. Setting the Halo function changes filtering behaviour to include/maintain all records sharing a common value in the specified field (column). For more information, see Using the Halo function. [39]
[40]Expand all - expands all visible Side Bar devices
Collapse all - returns all Side Bar devices to their collapsed state (default on opening)
Add new variable - brings up the Add Variable wizard...see Formulas & Variables [38]
Edit variables - brings up the Edit Variable wizard...see Formulas & Variables [38]
Convert all to exclusions - Converts the current settings of all query/filter devices into Exclusions (the results of Moves and Keeps), thereby setting the green IN universe independently of Side Bar settings...allows Side Bar devices to be reset and/or hidden without changing the current composition of the data universes.
Import XML query file - XML query files exported from Omniscope by one user, say a business user identifying data quality issues with specific records (e.g. corrections or suspicious data) can be imported by another Omniscope user, say the Database Administrator, who wants to view just the records at issue and decide whether to parse the XML file to import the corrections into the source database.
Export XML query file - Exports the current query settings as an XML text file which other Omniscope users can open to recreate the same display, assuming they have the same .IOK file version open.
Right-clicking on any device displays a series of options for resetting/hiding the device, and changing the filter type. Changing the filter type is sometimes necessary to facilitate user interaction. In the example shown below, the field 'Node' is an integer number field, displaying as a range slider (the default) and with the 'Include empty (null) values' box ticked. If it was better to have users search for a specific number by typing it in, we could change the filter type to Text search...without changing the data type to Text.

Below the Filter Type command are a series of commands for managing each field. These commands are the same as those accessible from the Main Toolbar: Data > Manage Fields menu, and are discussed here [41].
Each text filter device has a drop down options menu that allows you to further refine the status and behaviour of the device.
Choosing the Show Text tools option provides more options.
The leftmost drop-down allows you to specify the text filtering options to be applied in this filter:
Substring (default) -
Word prefix -
Exact -
Regular Expression -
Applies to version 2.4 only
The Sidebars are used to display filter/query devices and other options on either the right or left-hand side (or both) depending on the tab-specific settings on the Main Toolbar Controls drop-down menu:
![]()
Whenever either Sidebar opens, there are three menus displayed at the top; the Devices drop-down menu, the Tools drop-down menu, and the right corner [X] to close the Sidebar. The first time the Sidebar opens, three configurable display options (Reports, Search All, and Exclusions) plus filter devices for all fields (columns) in the data set will be ticked and therefore visible on the Sidebar.
To configure or re-configure the Sidebar, click on the Devices drop-down menu on the upper left:
 | Except in a general 'Data Set' tab intended to show everything, you will probably not want filter devices for ALL the fields (columns) to be displayed on most pages. Some field values may not be relevant to the message or useful for selecting/filtering the displays on a given page. Use the Devices drop-down menu to untick those fields to hide their filter devices. Use the drag hands at the right to move filter devices upwards or downwards to achieve the desired display on the Sidebar. You can also move the filter devices themselves into a new order by dragging and dropping them with the mouse up-wards or down-wards on the Sidebar. |
The three configuration options at the top of the Devices list (Reports, Search All and Exclusions ) will be displayed on the Sidebar only if you leave them ticked. Otherwise, untick these boxes and Reports tabs will display across the top of the Main Toolbar (the default), Exclusions (Moves and Keeps with history) will show on the Main Toolbar (without history), and Search All will be available in the Portal View [13], when open.
Note: Sidebar settings are specific to each Reports Page, and must be changed page-by-page inside Reports Mode. Sidebar settings established outside Reports Mode (always hit Escape to make sure you are not working in a specific Report tab) will apply outside Reports Mode. If you create one or more Report Pages, you can either keep your existing Sidebar settings the same or change them to suit each Report tab.
If you leave all three display configuration options ticked, the top of your Sidebar will look something like this:
 | Displaying Exclusions on the Sidebar has the advantage that you can expand the Exclusions device and monitor the history of your Moves and Keeps (see image below). This is especially useful when you are recording a power query sequence of Moves and Keeps to send to someone else as a query file for use with their copy of the file (see below for more on query files). Displaying Reports on the Sidebar is useful when there are very few, or when there are many Report Pages that need to be arranged in groupings. Like Search All above, any Sidebar text filter can be expanded to reveal a virtual keyboard for text search entry, with ANY and ALL multi-term search options. Omniscope text search works like a search engine, on one, several or all fields (columns)simultaneously. In any text filter, if you enter a single text string with no spaces, Omniscope will perform a prefix match, highlighting all records with text beginning with the search string. If you enter two text strings separated by a space and do not enclose them in "double quotes", you can search a field (column) of the data file for either one or both of the strings using the ANY or ALL search options. You can expand your search criteria to include values in other columns by simultaneously entering text strings in more that one filter device. To the right of each device you will see the hits in that column and at the top, in the barometer will show the combined record count. |
Note: Omniscope does not yet support an EXACT match option, so searching for numbers and text can return records whose values are supersets of the search term, i.e. a search for '22 ' will also display 222, 223, etc. leaving you to select the final records manually. (support for EXACT was added in version 2.5)
Notice that whenever a query device is actively filtering the data set, the device panel colour turns orange:
 | Closing the Sidebar with filters set will prompt a message either to reset all the filters, or to convert the query settings to Exclusions. If you wish to keep the same record set in the IN Universe with the Sidebar closed, you must choose Convert to Exclusions, which means that the filter settings will be translated to the equivalent Moves and Keeps that you can manage directly in the open views without the Sidebar. |
The Sidebar Tools drop down menu displays commands that affect the data and/or all other Sidebar query devices. The first three of these are especially useful when managing the creation of Report Pages and using them in live presentations.
 | Reset variables- Variables are input values not contained in a column of the data set that you can include in formula fields to facilitate dynamic modelling and sensitivity analysis. When you specify a Variable, you define a minimum, maximum and a default value in the range. Each variable defined in a file can display a Sidebar slider enabling users to change the assumed value. Clicking on Reset variables returns all variables to their default values. For more on defining and using variables, see Formulas & Variables [38]. Clear colour-by - each device has a small colour-by icon in the upper left. Clicking the device icon imposes the colouring scheme for that field (column) on all the open views that use colouring, like the Table View, the Tree View, etc. This command removes all overriding colouring schemes that have been set in the Sidebar (but not those already specified in the individual View Toolbars) Halo function: Also include records with the same value in: - a powerful feature for managing groupings or clusters within a data set. Setting the Halo function changes filtering behaviour to include/maintain all records sharing a common value in the specified field (column). For more information, see Using the Halo function. [39] |
Expand all - expands all visible Side Bar devices
Collapse all - returns all Side Bar devices to their collapsed state (default on opening)
Add new variable - brings up the Add Variable wizard...see Formulas & Variables [38]
Edit variables - brings up the Edit Variable wizard...see Formulas & Variables [38]
Convert all to exclusions - Converts the current settings of all query/filter devices into Exclusions (the results of Moves and Keeps), thereby setting the IN universe independently of Sidebar settings...allows Sidebar devices to be reset and/or hidden without changing the current composition of the data subsets.
Import XML query file - XML query files exported from Omniscope by one user, say a business user identifying data quality issues with specific records (e.g. corrections or suspicious data) can be imported by another Omniscope user, say the Database Administrator, who wants to view just the records at issue and decide whether to parse the XML file to import the corrections into the source database.
Export XML query file - Exports the current query settings as an XML text file which other Omniscope users can open to recreate the same display, assuming they have the same .IOK file version open.
Right-clicking on any device displays a series of options for resetting/hiding the device, and changing the filter type. Changing the filter type is sometimes necessary to facilitate user interaction. In the example shown below, the field 'Node' is an integer number field, displaying as a range slider (the default) and with the 'Include empty (null) values' box ticked. If it was better to have users search for a specific number by typing it in, we could change the filter type to Text search...without changing the data type to Text.
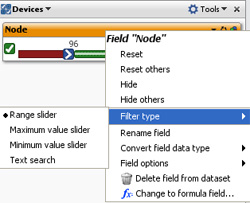
Below the Filter Type command are a series of commands for changing the filter types for each field. These commands are the same as those accessible from the Main Toolbar: Edit > Manage Fields menu, and are discussed here [41].
By default, Omniscope works with 4 defined sets/subsets of the integrated data set; ALL data, filtered IN data, filtered OUT data and Selected data. Files open with all records in the inegrated data set visible in the default filtered IN subset.
Omniscope has two query modes; Sidebar instant filtering, or Main Toolbar Selection, Moves & Keeps, whereby some records are transfered to the filtered OUT data subset as shown in the barometer.
You can define additional subsets of data which can be displayed alone or in conjunction with the defined data sets/subsets using Named Queries.
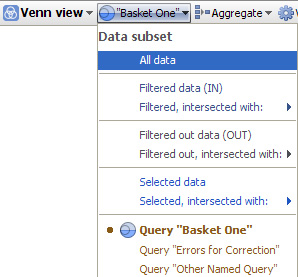
The Named Queries drop-down menu is immediately right of the Barometer, and provides all the commands required to define and manage Named Queries, combinations of filter settings or record selections which define selected or filtered subsets of the file data expected to be used frequently in configuring the views in the file. In the example below, 3 Named Queries have been defined; 'Basket One', 'Errors for Correction' and 'Other Named Query'. At right, the example Venn View toolbar has been set to display the records contained in the Named Query 'Basket One'.
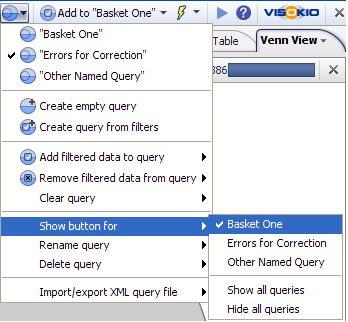 | Each View Toolbar includes a Data Subset drop down where you specify which of your defined Named Queries (in brown) should be displayed in the view:
|
Named Queries can be defined using either Create empty query or Create query from filters.
Create empty query - give the query you plan to populate a unique name for this file. The new query will appear at the top of the Named Queries drop-down list, and become a side menu option for commands such as such as Clear, Rename and Delete Query. The Show button for option places a button with the name of the selected Named Query/data subset on the Main Toolbar to the right of the Named Queries drop-down menu. These button(s) make it easier to manage adding or deleting selected/filtered IN records from multiple Named Queries. Once an empty query has been created, e.g. 'Basket One' or 'Errors for Correction' you can add filtered IN or Selected records to these queries at any time using Add or Remove selected/filtered data to query (if records are Selected, these records will be added/removed, if not, then the current contents of the Filtered IN subset will be added/removed to/from the Named Query you select from the sub-menu at right.
Create query from filters - this option lets you preserve the current pattern of filters set in the Side Bar as a Named Query. You can subsequently refine the data set defined using Add or Remove selected/filtered data to query.
Import/export XML query file- the definition of any query in the file can be saved in XML file format and exchanged with others using the same Omniscope file. This is useful for example, for highlighting anomalies and errors in the data requiring correction.
From version 2.5, most Omniscope View Toolbars include an Aggregation drop-down dialog which enables you to define an aggregated transformation of the underlying granular data set, and also define the aggregation functions to be applied across the aggregated values in each field (column). Each view on any given tab can use a different aggregated view as defined by the settings on the View Toolbar Aggregation drop-down.
Note: Formula columns can be set to apply the defined logic to the aggregated, rather than individual, row values by choosing 'Apply formula' as the aggregation function for the formula field.
Consider the unaggregated data set illustrated below and downloadable here [43]. Potential 'Aggregation Field 1' has 7 unique values, and potential 'Aggregation Field 2' has an additional 4 values uncorrelated with the 7 values in 'Aggregation Field 1'. In addition, there are Category, Numeric and Time & Date fields in the data set:
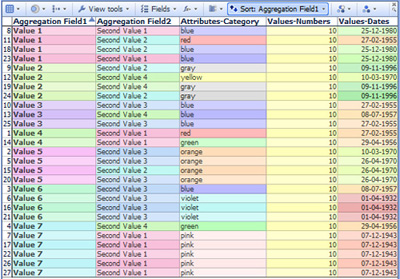 | 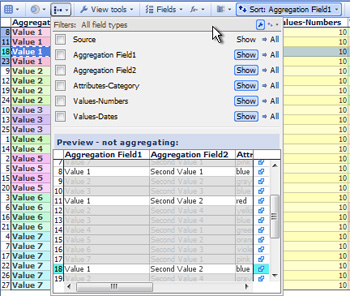 |
Use the Aggregation drop down menu found on most View Toolbars to define view-specific aggregated transformations of the underlying data set. The example above shows how to customise the drop-down fields and use the Preview window. In this case, the uniform value field 'Source' is being hidden, since aggregating by a single value will collapse the entire data set into one row. Notice that selections in the view are shown with brushing (fading) in the Preview window, enabling us to confirm that Value 1 is associated with both Second Value 1 and 2.
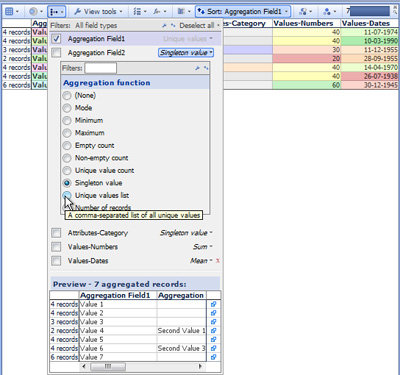 | Ticking a field on the Aggregation drop-down tells Omniscope to aggregate by the unique values in the chosen field, apply the default aggregation function to the values in the other fields, and display a view-level mini-barometer upper right with the aggregated record count. In this case, the result is 7 aggregated rows, one for each of the unique values, with the 'Values-Numbers' summed and the average (mean) of the 7 aggregated 'Values-Dates' displayed, since those are the default aggregation functions. Notice that the row headers now display how many individual records (rows) have been aggregated into each aggregated row. Aggregation functions are applied according to the defaults, but these can be changed for each field (or set to None) using the drop-down menus at right. Hover your mouse over each possible aggregation function (the list will depend on the data typing assigned to each field) and the tooltip will provide a definition of the function to be applied to that filed when aggregated. You can also change the default for a given field. |
Aggregating by multiple fields will usually increase the resulting row count, since all unique combinations of field values from all fields will become aggregate rows. IN the example below, the data set is being aggregated by both Field 1 and Field 2, resulting in 12 rows as shown in the mini-barometer:
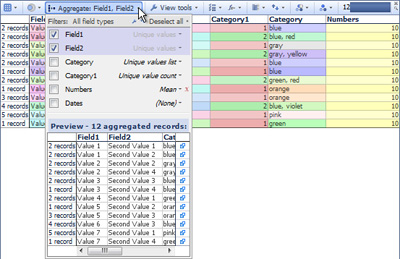 | In this case, the Category column was duplicated and two different aggregation functions applied; unique value count (which counts how many different colours are in each aggregated row), and unique values list (which lists all the unique values in the underlying rows). The aggregation function for 'Numbers was changed to Mean (average), which shows the original value of 10, which will stay the same no matter how many rows are aggregated, since the value was constant in the unaggregated data. The aggregation function for Dates has been set to None, which results in the Dates filed being hidden in the aggregated view. |
Many Views include an Aggregation drop-down menu, used to define aggregated views of the data, together with the function to be applied when aggregating each field (column). Aggregation differs from the presentational Grouping options available only in the Table View. Unlike Grouping, the end user is not meant to 'unroll' or 'drill down' defined aggregations to lower levels of granularity. User-interactive Grouping can be used in the Table View in addition to Aggregation. For example, a file with each row defined as an observation for a given day can be aggregated by week, then grouped by month and year. In the resulting presentational Table View, an end user would be able to unroll the groupings down to weeks, but to see the maximum granularity daily data, they would either have to remove the Aggregation settings (which they cannot do in a free Viewer) or just click to the 'Data Set tab (which they can do in a free Viewer).
Links:
[1] http://kb.visokio.com/visualisation-phase
[2] http://kb.visokio.com/queries-subsets
[3] http://kb.visokio.com/aggregate-data
[4] http://kb.visokio.com/table-view
[5] http://kb.visokio.com/chart-view
[6] http://kb.visokio.com/pie-view
[7] http://kb.visokio.com/bar-view
[8] http://kb.visokio.com/graph-view
[9] http://kb.visokio.com/tile-view
[10] http://kb.visokio.com/pivot-view
[11] http://kb.visokio.com/tree-view
[12] http://kb.visokio.com/network-view
[13] http://kb.visokio.com/portal-view
[14] http://kb.visokio.com/map-view
[15] http://kb.visokio.com/venn-view
[16] http://kb.visokio.com/web-view
[17] http://kb.visokio.com/content-view
[18] http://kb.visokio.com/dial-view
[19] http://kb.visokio.com/details-view
[20] http://kb.visokio.com/dataplayer-view
[21] http://kb.visokio.com/node/226
[22] http://kb.visokio.com/node/225
[23] http://kb.visokio.com/node/228
[24] http://kb.visokio.com/node/229
[25] http://kb.visokio.com/node/227
[26] http://kb.visokio.com/node/230
[27] http://kb.visokio.com/node/264
[28] http://kb.visokio.com/node/232
[29] http://kb.visokio.com/node/231
[30] http://kb.visokio.com/node/233
[31] http://kb.visokio.com/node/263
[32] http://kb.visokio.com/node/234
[33] http://kb.visokio.com/view-toolbar
[34] http://kb.visokio.com/files/Resources/OUGuide/235_Data_Universes/Everton_Universes_Tutorial.iok
[35] http://kb.visokio.com/using-basket
[36] http://kb.visokio.com/export-files
[37] http://kb.visokio.com/report-pages
[38] http://kb.visokio.com/formulas-variables
[39] http://kb.visokio.com/halo-function-help
[40] http://kb.visokio.com/node/372
[41] http://kb.visokio.com/manage-fields
[42] http://www.regular-expressions.info/
[43] http://kb.visokio.com/files/Resources/OUGuide/565_ExploringData/548_Aggregation/AggregationDemoFile.iok