Welcome to Omniscope! This section covers the basics of Omniscope, and provides links to more detailed sections located elsewhere in this User Guide and our KnowledgeBase [1], which contains more depth of technical articles and worked examples. The Training Guide [2] at the end of this section provides a phased, step-by-step 'roadmap' to fully configuring any Omniscope file, with detailed checklists you can print and follow as you work through your files.
Overview [3] - a one-page general introduction to the process of using Omniscope.
Installation [4] - This page covers installation on machines running the Micrsoft Windows operating system. If you are installing from a Mac, the Mac version will be preselected and you should follow the instructions that appear on the download page. There are currently some Mac version limitations [5]. To use with Linux/Unix, an experimental JAR-only version of the free Viewer is available. Choose "Linux / JAR-only" on the download [6] page, and see Command Line [7] for more information on using this. More detailled information on installing on other operating systems (Mac, Linux, etc.) is in the KnowledgeBase [8].
Activation & De-activation [9] - describes the process for activating (new installations), refreshing (version upgrades) and deactivating Omniscope installations prior to re-building or moving machines.
Welcome Screen [10] - the Welcome Screen opens before any file is loaded, with shortcuts to frequently-used commands, recently opened files, links to demos and links to learning resources. Note: The Welcome Screen will look different in free Viewers [11] than it does in activated editions used to import/edit data and configure files.
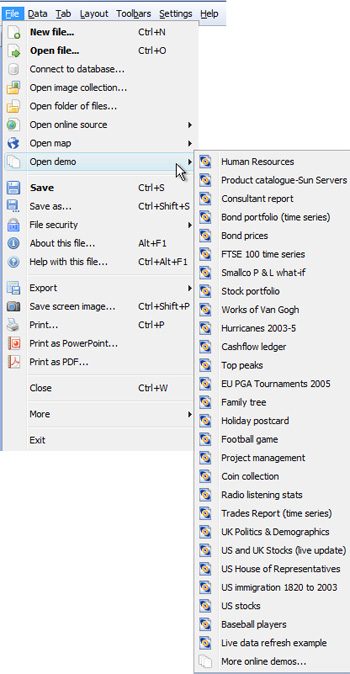
Opening demo files [12] - opening the demo files included with Omniscope is a very good way to learn what is possible. During your free trial, you can export the underlying data then try re-configuring the file to match the demo. Additional online demos are here [13].
Training Guide [2] - start by following this 6 phase, step-by-step detailed checklist approach to importing data, configuring views, creating a presentation and sharing it with others.
Omniscope free Viewer will open any Omniscope .IOK file of any size, up to the limits of your PC [14]. Each new Viewer installation also includes a free 30-day trial of Omniscope Professional. During the 30-day trial period, you can import your own data from spreadsheets and databases, and you can export data from any of the embedded or online demos as spreadsheet files to see how these files were configured from tabular data. You can also use the DataPlayer View to create exportable, interactive Flash DataPlayers for embedding in web-based 'dashboards' and common documents like PowerPoint, Excel and Adobe Acrobat .PDF. After the 30 day free trial expires, the installatation reverts to being a free Viewer, so there is never a need to un-install.
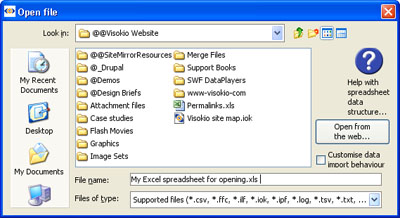
If you don't yet have Omniscope installed, install the free Viewer [6]. The installation sequence (for Windows) is shown here [4].
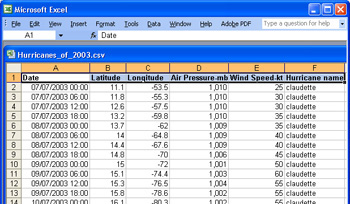
You can open tabular data sets such as spreadsheet files directly in Omniscope. A sample 6-column .CSV file for use with this Quick Start page is attached here [15]. Download the sample data file, or choose a different file containing your own data. Try to avoid any blank rows, formatting and merged cells in your source spreadsheet file. Check that your spreadsheet looks like this. [16]
 |  |
During your 30-day trial period, or if you are already running an activated Edition, you can open any of the demo files and use File > Export > Export files and select the Data tab to save the data as a CSV or other supported file type. You can then re-import the data using File > Open file [17], and compare with the embedded demo to see how the demo file looked before it was configured. For more detail, see the section on Importing Data [18].
Omniscope will open the file displaying three default views; a Table View, a Chart View and a Pie View, as well as the right Sidebar, with various filter devices created by default.
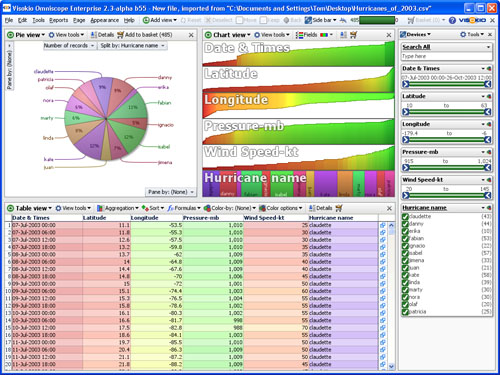
The Table View is most familiar, but the Chart View is very useful for gaining insight into the structure of the data set at a glance.
Omniscope examines the data in each column and makes some assumptions about the column's data type, which are not always optimal. When importing data for the first time, always check and (if required) modify the data typing (i.e. whether a column's data is typed Numbers, Dates and Times or Text). If there are only a limited number of different Text values, Omniscope will usually type the data as Category. To review and edit data typing, click on Data > Manage Fields [19].
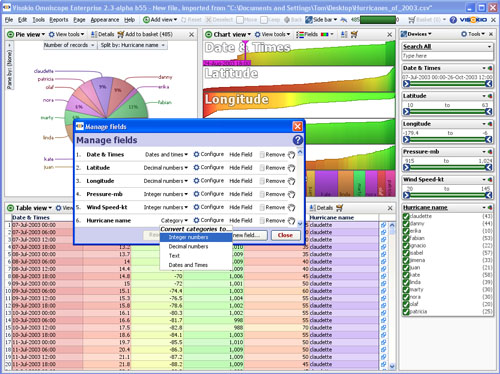
Frequently, Omniscope assumes that identifying numbers should be treated as integer numbers. You should change the data type of all-numeric reference identifiers to 'Text'. Remove the separators in the number before converting to text using Options > Formatting options: {untick} Show thousands separator. Also, for some date and time fields you may be asked to clarify the date/time format used in your data before Omniscope can recognise it accurately as dates and times. For more detail on data typing options see Data > Manage Fields [19].
 [20]
[20]
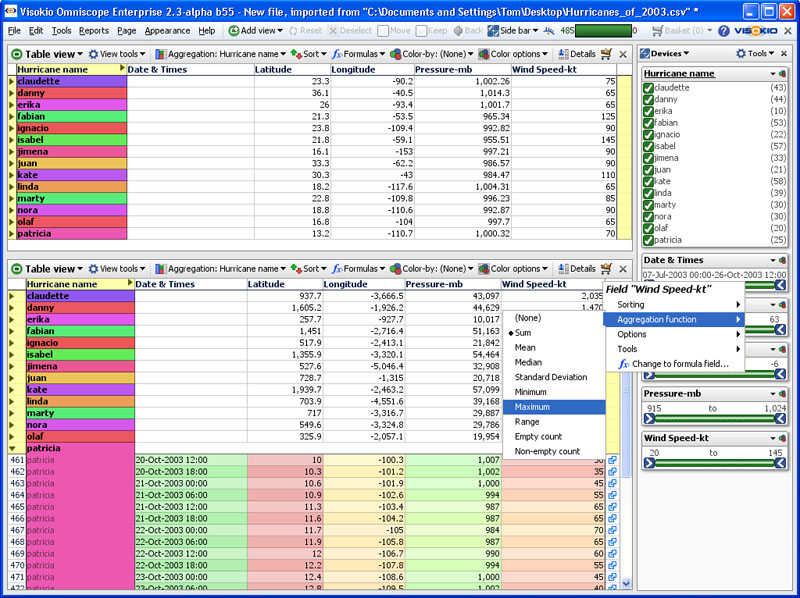
Using the hurricane example file, close the Pie and Chart Views, and open a Table View. Click on the Aggregation command to aggregate all the observations over time by Hurricane Name. By default, all of the columns will show the sum of the observations, nonsensical in this case. Right-click on each column header, choose Aggregation function and display the median for the Longitude and Latitude columns, the mean (average) Pressure and the maximum Wind Speed. The example above shows two Table Views, the lower with the aggregation functions defaulting to Sum, and the upper showing the same data with the view configured to show meaningful results that can be used to spot errors in the data. From version 2.4, the Aggregation drop down menu on the View Tolbar can be used to set both the fields to aggregate on and the aggregation functions to apply to visible columns in the aggregated view.
For more detail, see Using the Table View [21]
Next open only the Chart View, which provides a horiziontal overview of all the columns in the data set. In the Chart View, under View Tools > All charts, for each field (column) name you can decide how to graph the values in each column, e.g. histogram bars, pie charts, statistical summaries, etc. Use this analytical view to further scrub your data.
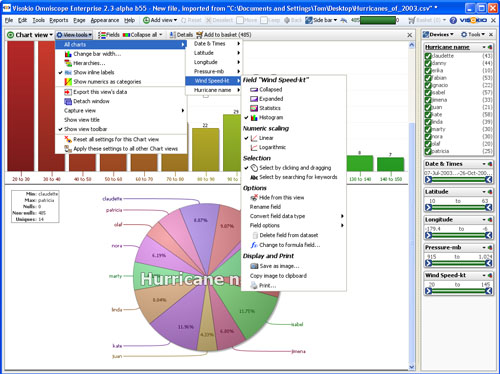
The right-click menu provides links to many other settings related to the selected field (column). You can re-order or hide fields that are not required by dragging or unticking them in the Fields drop-down pick list.
For more detail see Using the Chart View [22]
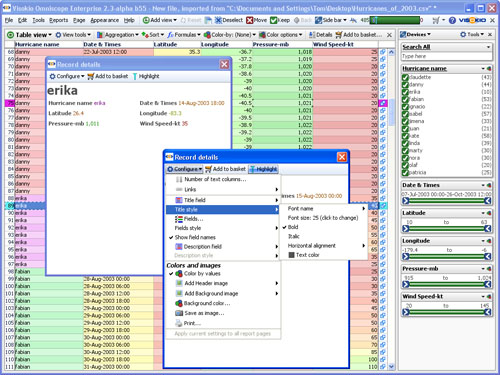
To see the values of all the fields for a given record (row), in the Table View, double-click on the record (row) header (farthest left). A configurable Details pop-up window appears, showing the values for the selected record. You can configure the Details pop-up window extensively using the Configure menu.
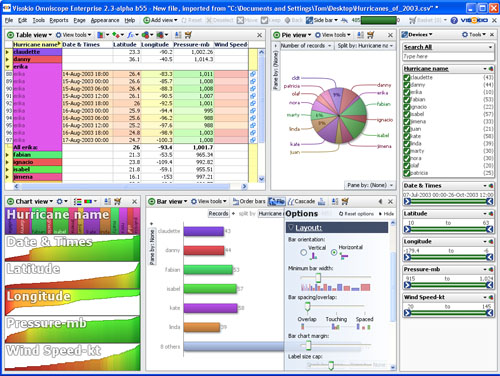
Omniscope has 12 different views that can be used to visualise and explore your data. Click on ![]() Add View in the Main Toolbar and try each of the views not already showing. Each view has its own Toolbar and pick lists for selecting which fields (columns) to display. The powerful Bar View has a tab that you pull from the left side to reveal all the options. When you have finished with a view window, click on the [X] in the upper right hand corner to close it.
Add View in the Main Toolbar and try each of the views not already showing. Each view has its own Toolbar and pick lists for selecting which fields (columns) to display. The powerful Bar View has a tab that you pull from the left side to reveal all the options. When you have finished with a view window, click on the [X] in the upper right hand corner to close it.
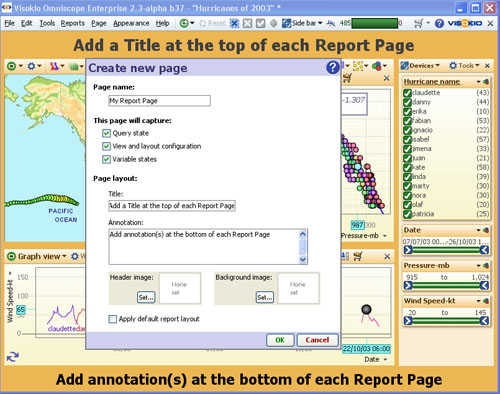
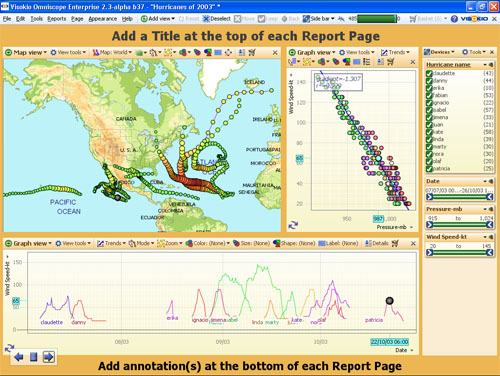
All users of your Omniscope file are not expected to know how to open views, set multiple filters etc. Instead, you decide the most important combinations of views, filter settings and messages to other users, and save them as persistent tabs, which can be considered report pages or simply separate workspaces. Tabs are preconfigured combinations of views, filter settings, formula variables and annotations. If you save an .IOK file in Reports Mode with a Report Page selected, it will open and navigate just like a slide show presentation.
To create a tab in your file, click on Tab > New > From current layout from the Main Toolbar.
If you make further changes to a tab, always remember to click Commit to make them lasting. If you do not wish to change a tab after performing some operations on it, click Revert to return the Report Page to its configuration when you last committed or created it. This is useful when giving live presentations. There is also an optional floating tab navigator in the lower left-hand corner, which reveals itself when you hover your mouse (Toolbars > Floating tab navigator). For more detail, see Creating and Managing Report Pages [23].
Omniscope integrates with the Web by incorporating defined links based on your data. Values in your data are automatically transformed into links when users of your files click to display related web pages. The web pages can display either in the Web View of Omniscope, or the users' default web browser. To configure your own web links or add links to local documents on your network, use the Add links wizard available from Settings > Links > Add web or Add local link.
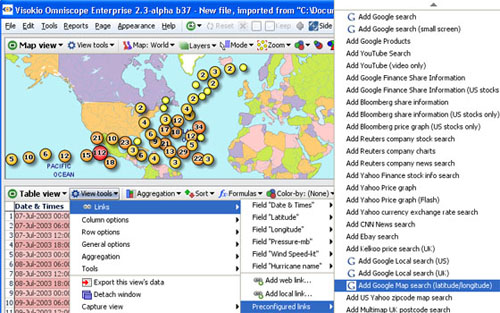
Omniscope also includes pre-configured links to popular, free web services that accept a single string of text as an input, such a Google, EBay or Wikipedia searches, or financial data on specific securities from Bloomberg, Reuters, Yahoo etc. Select Settings > Links > Preconfigured links to see the menu of currently available free web services.
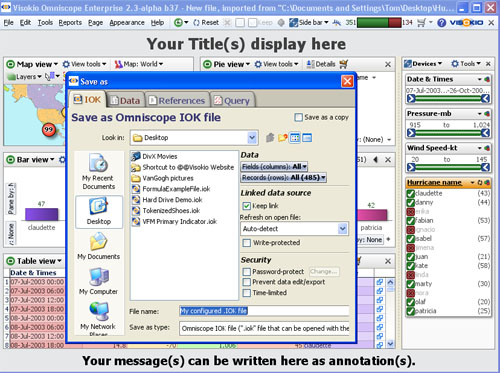
Once configured, save your Omniscope file using various options for distribution. Go to File > Save As and you will be presented with the Data Export wizard set to save your file as IOK files. This wizard offers many options to save all or only selected subsets of your fields and/or records, plus the option to set file update/refresh options, and to protect your data from unauthorised access and copying.
There is a single installer file for all Editions available from our downloads page. [6]
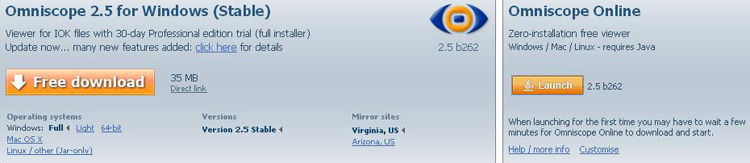
Full - the first time you install Omniscope, you will be offered the full installer, which includes a full version of Java that will be installed as the private virtual machine (PVM) together with Omniscope. If you update a beta version of Omniscope frequently, you can update your installation using the much smaller Light installer. However, due to bugs in Java being fixed all the time, it's best to download a full version of Omniscope, with the latest version of Java, at least once per month.
64-bit - If you are using a 64-bit operating system, make sure to download the 64-bit version of the installer. More on 64-bit operation. [24]
Omniscope Online - if you are on a machine that does not allow you to install Omniscope, you can still download the free Viewer from the Launch link, and use it to explore the demo files and other IOK files you may have received. More on using Omniscope Online [25].
Omniscope is a standalone installed application requiring administrative privileges to install. There is only one installer file to download for all Editions of Omniscope. The installer includes a 30-day free trial of Omniscope Professional. On expiry of the initial 30-day trial, the installation will revert to a free Viewer, which never expires. There is never any need to uninstall.
To install on Windows, visit our download page [6]and click on the Free Download orange colour button. If you are installing on a 64-bit machine, make sure to select the 64 bit installer. Use the full installer the first time you install, but you can later choose 'lightweight' installer to speed download times.
1.) Click "Run" or "Save" when prompted. 2.) If you choose "Run", the installer wizard will launch automatically. 3.) If you choose "Save", the installer file OmniscopeOfflineInstaller.exe will be saved. if you choose "Save", 4.) Find the file "OmniscopeOfflineInstaller.exe" file (icon shown right) and double-click to launch the installer wizard. |  |
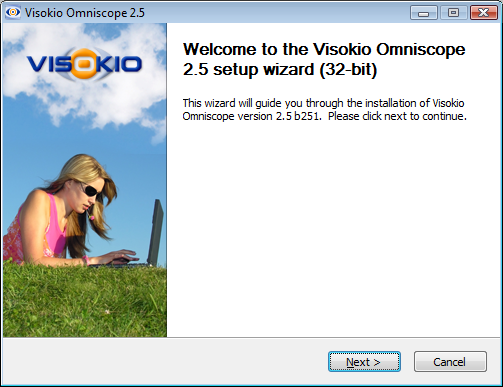
When the installer is started you will see Vista User Account Control prompt: "Program needs your permission to continue". Click Continue to proceed. Please note that if you are not logged in with Administrator privileges on the machine, you will need someone with an Administrator account to install Omniscope. This will change in version 2.6.
The next screen is the set-up wizard, click Next >
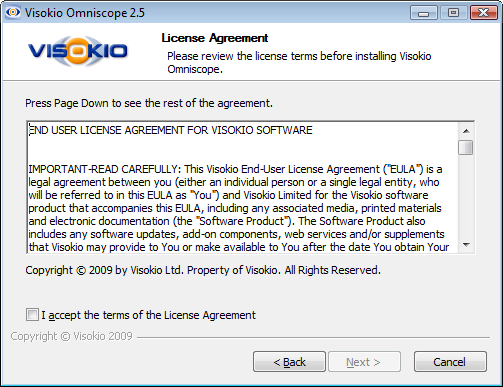
The next screen asks you to accept our licensing agreement. More information on the terms of our licensing is available here [26]. Tick the "I accept the terms of the License Agreement" box and the Next > button to continue.
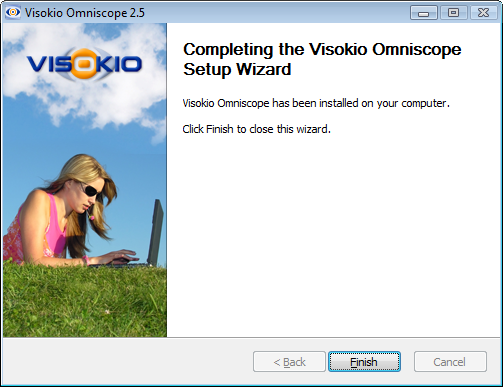
You will see an installation progress bar, a list of files being installed and then this screen: Click Finish.
Unless you have previously licensed Omniscope, your installation will open as a free Viewer, allowing you to open and navigate any Omniscope .IOK file, such as the many embedded and online demos. [13] In addition, all free Viewer installations come with a free 30-day trial of Omniscope Professional, enabling you to make files with your own data. At the end of the trial period, unless activated the installation reverts to a general-purpose free Viewer...no need to uninstall.

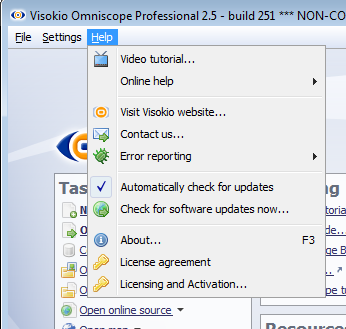
By default, Omniscope installs with the option to automatically check for updates ticked. Test that you have the latest version, and that your automatic update function is working by clicking Help > Check for software updates now...
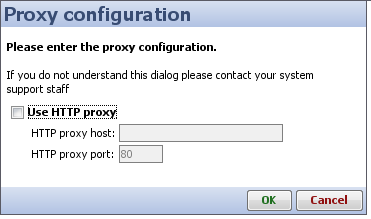
If you have a problem contacting our update server, it may be that your machine is accessing the Internet via another machine known as a 'proxy server'. Due to limitations in Java, Omniscope is sometimes not able to detect these settings automatically. They useful not just for updates, but also for Activation, bug reporting, etc.
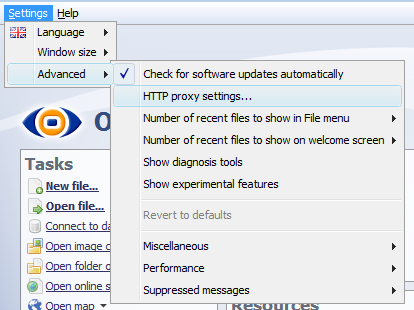
If your organisation is using a proxy server, you may need to ring your support person or network administrator to discover the settings Omniscope needs.
 [27]
[27]
More information on Proxy Settings [28].
If you intend to install an Enterprise Edition with automated Scheduler and Generator capabilities, make sure to install on a machine that will not be turned off, and activate the installation from an account that will not log-off. See the Automation [29] section of the KnowledgeBase for more information on installing an Enterprise Edition as a Windows Service [30] to provide always-on data refresh and other automation services.
Omniscope opens to display the Welcome Screen with shortcuts to frequently-used commands, recently opened files, links to demos and links to learning resources.
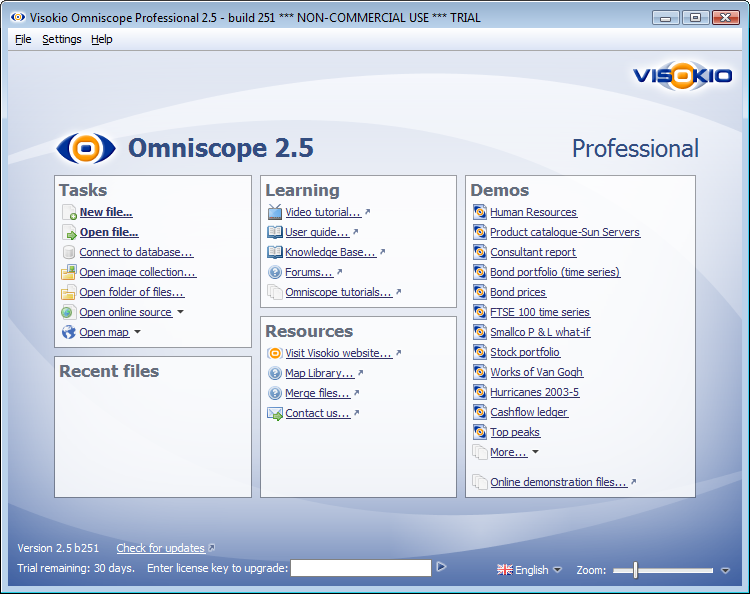
TasksThese commands are also on the File menu on the Main Toolbar, but can be used from the Welcome Screen for connecting directly to sources of data (including online data sources, images and maps) which are not already in an Omniscope file. | LearningLinks under this heading point to various resources for learning more about how to use Omniscope. | DemosOmniscope is completely general-purpose. Embedded demos provide working examples of how to use Omniscope to make the most of your data. A wide range of examples are provided drawn from a cross section of typical uses. | ||
Recent filesDisplays the files you have open most recently. Clicking on these links will open the file, provided the file name and location have not changed. | ResourcesLinks under this heading direct you toward potentially useful sources of information, maps and data you may wish to add to your files.
| |||
ActivationYour version/build number is displayed at bottom left, and you can click 'Check for updates' to ensure that you have the latest build for your version. If you are unactivated and still in your 30-day trial period, a link is displayed for you to contact us for a formal trial key, or an Enterprise trial key. Once you have a key, you can activate by entering it in the text box. | LanguagesChoose the language you want Omniscope to display in commands menus and dialog. Languages displayed in violet are less than 90% complete. Anyone can add a new translation or improve/localise an existing one using Omniscope as explained here [32].
| ZoomKnown as screen resolution in earlier versions, Zoom allows you to magnify or reduce the entire Omniscope interface to make text and buttons larger or smaller. Use Zoom to increase the readability of text on a high-resolution screen, or reduce the size of buttons on low-resolution screens. Zoom can improve legibility of printed output and is also useful for the visually impaired. |
![]() When you have a file open, you can still zoom in and out by clicking on the Zoom icon/drop-down in the Main Toolbar of the application. You can also revert back to the default settings by clicking on the Revert to default option which is located under the slider. This option is also available from the Welcome Screen by clicking on the small black triangle right of the zoom slider in the bottom right hand corner.
When you have a file open, you can still zoom in and out by clicking on the Zoom icon/drop-down in the Main Toolbar of the application. You can also revert back to the default settings by clicking on the Revert to default option which is located under the slider. This option is also available from the Welcome Screen by clicking on the small black triangle right of the zoom slider in the bottom right hand corner.
Full working examples showing the many features of Omniscope are available either from File > Open demo or the Welcome Screen [10]. During your free trial, you can try exporting the underlying data sets as CSV spreadsheet files using File > Export > Export file {Data} dialog, then using File > Open file to import the exported data set and configure it to match the original demo file.
 | Human resources - a very comprehensive demo file based on a typical company staff. Every record (row) is a person, with images, a position in an organisational hierarchy, and an office location for mapping. Includes multi-variate simulation modelling of salary increase options and an alerts dashboard. |
Anyone can configure Omniscope files systematically following the 6-phase checklists outlined below. Most issues in configuring Omniscope files arise because essential steps like changing default data typing assigned on data import are not addressed BEFORE moving on to other tasks. Following the checklists below, anyone can achieve rapid, reliable results and make best use of Omniscope. This phased outline and checklists also serve as a useful guide for structuring training sessions.
Options for importing data into Omniscope include importing from delimited data files like CSV and XLS, relational tables/reporting views created using SQL statements that return a table, various remote-hosted or 'cloud' based data sources via connectors, transformed tabular XML [39] and some multi-dimensional 'cube' data structures (Data Manager Edition only). The Enterprise and Data Manager Editions (2.6+) has a dedicated visual drag and drop data assembly, filtering and transformation Data Manager [40] workspace that can be used independently of Omniscope. The Professional Edition has Most of the options are documented in the Importing Data [18] chapter of this User Guide, which includes sectons on creating [41]and importing data files [17], making and refreshing database connections [42], using connectors [43] to online/remote data sources and more. More technical articles and examples relating to importing data via Data Manager or the Professional EDition Data Import and Merge Wizards are available in the KnowledgeBase [1], which includes sections on supported data file formats [44], examples of database connections [45] using ODBC and JDBC, and other related topics.
This checklist covers tasks you should perform AFTER importing a starting data set for the first time, but BEFORE beginning to analyse how to filter, visualise or present the complete data set. Most of these tasks are coved in the Editing Data [46] and Managing Data [47] chapters of the User Guide.
The Data Management phase focuses on data set completeness and correctness. Data typing assumptions made by Omniscope on import should be checked, columns duplicated, expanded, collapsed or tokenized to facilitate end-user interaction with your file. In this phase, 'data scrubbing' view configurations (rather than final presentational views and layouts) are used, normally working on a single tab entitled 'Data Set' or similar. Use Table View column sorting and the Chart View to examine extreme values in each column, correct null (blank) and missing values, and add related content to the file, such as image sets, maps and links to related web pages and web services.
At the end of this phase, the single 'DataSet' tab should reveal all non-empty and non-uniform data fields and filters, using both Sidebars if necessary to check all the filter devices in the Table/Chart View(s) without aggregations or groupings. You may need to duplicate certain columns so that they can be typed or formatted differently, providing different filtering options for users. Note: it is good practise to always leave this unfiltered 'Data Set' tab accessible as the final tab on the far right of the file tab set, providing an instant, credibility-enhancing maximum granularity view of the data to any user who clicks on the tab.
This phase focuses on optimising the data set for its intended audience. The checklist covers tasks you should perform, or options you should consider AFTER you have imported/merged all the data sources and 'scrubbed' the data to ensure correctness and completeness, but BEFORE you begin to define the best ways to visualise and present the data set as a presentation or reporting 'dashboard' file. Most of these tasks are covered in the Managing Data [47] and Configuring Files [48] chapters of this User Guide.
In this phase, column re-naming should be used to shorten names to save space and make them instantly meaningful to the end-user audience. Unneeded columns (especially empty or uniform-value columns) can be hidden or deleted, and the number of unique category values can be reduced, either via re-naming/consolidating values with data edits, or by adding formula columns that re-categorise records into fewer categories. Formulae can also be defined to transform imported data fields into more useful values and to detect alert conditions to be highlighted. If you use formulae to convert/reduce total category values, or to extract useful data fields from within text strings, your changes will be re-evaluated on every refresh. Aggregations can be set and aggregation formulae specified to create transformed views of the data for use with most views.
At the end of this phase, all the data, images, maps and link references required to meet end-users' requirements should be in the file, and the single 'Data Set' tab should show all the fields, both data and formula, which have not been globally hidden. Additional 'Subset', 'Formula' and 'Aggregated' tabs will have been added to show useful data subsets made reference-able as Named Queries, the inputs and results from defined Formulae, and various Aggregation settings with key values calculated according to specified aggregation functions displayed. Don't worry, you will delete all these preliminary testing tabs by the end of the next phase.
This checklist covers tasks your should perform, or options you should consider, AFTER you have optimised your data set, defined reference-able data subsets i.e. Named Queries, added Formula fields that calculate useful values and alert conditions, and defined useful Aggregation settings (including aggregation functions by field/column), but BEFORE you decide the optimal combinations of views that best suit the requirements of the file. Most of the documentation of the Views and how each is best used is in the Exploring Data [49] chapter of the User Guide.
Omniscope offers a large and growing number of views, each of which is highly configurable. In the Visualisation phase, you test each View on its own tab, seeking the best configuration(s) of each view for the data set and the requirements of your intended audience. You may create more than one variant of each view. Views determined to be of limited value to the audience can be hidden.
At the end of this phase, you should have a tab for each view you plan to use, with one or more variations of the view on each tab, perhaps some displaying subsets of the data defined by Named Queries, and others displaying Aggregated views with column-specific functions as defined in the Aggregation settings in each view.
This checklist covers tasks your should perform, or options you should consider, AFTER you have defined the views you plan to use, but BEFORE you create the tab sequence that will convert your file into a final presentation. Most of these tasks in this phase are documented in the Reports & Presentations [50] chapter of the User Guide.
Unlike previous phases, the Presentation phase takes a minimalist, 'zero-based' approach to file configuration, i.e. the bias is that everything should be hidden unless it is needed on a specific tab to make a specific point or enable a particular end-user interaction. Working with the most useful view configurations created in the previous phase, the objective of this phase is to create a multi-tabbed presentation where each tab is addressed to a specific issue with a specific message supported by the data. In this phase the philosophy is "less is more" to simplify the audience experience, but with credibility-building granular detail always only one click away. Don't be afraid to create many different tabs, each focused on specific user groups and points to be made, rather than trying to put too much on one tab. The objective is to create a file that opens and navigates just like a slide presentation.
At the end of this phase, you should have a highly-visual, interactive, multi-tabbed presentation file that your users can quickly and easily consult, filter, and print.
This checklist covers the final file configuration options relating to branding, data refresh and how others will be able to use the file. Most of the tasks in this phase are documented in the Save & Export Files [51] chapter of the User Guide.
In this phase, Help screens are added, along with selected branding options (opening screen, closing screen, banner ads, corner logos, etc.). File settings relating to refresh, file security, and other publishing options configured in the file when saved are all considered in this final phase.
The Data Import phase is documented primarily in the Importing Data [18] sections of this User Guide, which includes topics such as importing data files [17], making and refreshing database connections [42], and using connectors [43] to online/remote sources and more. More technical articles and examples are available in the KnowledgeBase [1], which includes sections on supported data file formats [44], examples of database connections [45] using ODBC and JDBC and other related topics, such as importing transformed XML. [39]
Getting started with Omniscope usually involves importing a copy of a structured table of data, such as a spreadsheet file or a reporting view from a SQL-based relational database. Options include:
1-01 Create new file [41] - manually type or cut and paste data into a blank Omniscope file
1-02 Open data file [17] - import data from a delimited data file (see potential issues list below)
1-03 Connect to database [42] - connect to a relational database using ODBC or JDBC protocols
1-04 Using Connectors [43] - use one of the available Connectors to access/import remote-hosted data
1-05 Open image collection [52] - open and import a folder of images, together with user-editable tags
1-06 Folder of files [53] - access and analyse a folder of files (documents, audio/visual media, etc.) to create a data set of filenames/paths and user-editable tag names
1-07 Open map [54] - access our Map Library [55], download a geo-coded map file and build a data set, including manual or automatic placement of records by decimal longitude/latitude. Alternatively, screenshot an online map image, note some reference coordinates, then use Omniscope to geo-code the image and build a data set to overlay the image map.
1-08 Perform merges [56] - Use the Merge Wizard if additional data from other sources needs to be joined or concatenated with your initial data set. Before performing a join, test the uniqueness of join criteria columns using the Table View: View Tools > Tools > Select duplicate records command.
Note: If new, currently unspecified columns might be added to one or more of your merge files in future, do not specify the fields to import, so that Omniscope will continue to import all fields in future. You can then Hide or Delete any unneeded fields as a remembered action.
Data files are often not delivered formatted according to precise international standards. Differences in formatting of data within tables and delimted files around the world can affect data import and display in Omniscope. Below are some common issues which you may encounter when importing data tables into in Omniscope:
Regional formatting - When importing data by opening a CSV or Excel XLS file, Omniscope analyses the data in the file to determine how the data is arranged and which fields (columns) are most likely of data type Text, Numbers, or Dates & Times. The regional settings in your computer's operating system (Windows, or Mac, etc.) have a strong influence on this operation. For some combinations of settings and data formats, Omniscope cannot reliably detect the situation automatically. If your data opens incorrectly and your fields are not correctly structured, numbers have the wrong decimal place, etc. please consult the File > Open file [17] dialog page, which contains options to help with these situations.
For example, if you know your data has been formatted for a different region, change the Locale drop-down accordingly. For example, if you live in Germany but have received a CSV from an American customer, you should choose "English (US)". If you find Omniscope gets things wrong and your data is incorrectly recognised, you can disable auto-detection of dates and numbers by deselecting the two Recognise... check boxes on the File > Open file [17]dialog. All fields will open as Category or Text data and their text values will be preserved. You can then use Data > Manage fields [19] [57]to configure each field (column) as you would like it to display.
Data file delimiters - CSV stands for "Comma Separated Values", which means the cells in each record (row) of the data table are separated by the comma character. However, this is not a formally-documented standard, and if you are in a region that also uses the comma in numbers instead of the decimal point (e.g. several European countries, such as France), some versions of Excel create CSV files that use a semicolon as the separator character. Sometimes these multi-column tables files are saved with a CSV or even a TXT extension. Omniscope is unable to detect this situation automatically. If you open such a file in Omniscope, your data will very clearly be wrong, with most columns appearing as text with semicolons. To avoid this problem, use the File > Open file [17]Customise data import dialog to change the separator character to a semicolon " ; ". You can also do this with 'pipe' "|" delimited files, but you must first change the file extension on the data file to .CSV, even though the file is really is 'pipe' and not comma delimited.
Dates & numbers - If you are running on Windows, when importing data that is in a delimited text format such as Excel XLS, CSV or TSV (tab-separated values), Omniscope will use your Windows Regional Settings to try to automatically recognise data. For example, for a PC with United States Regional Settings, Omniscope will recognise "5/13/2005" as a date and "1,500.5" as a number. For some international users, however, this may not work as expected and the result will be an import of all columns as data type Text (shown in Omniscope either as multi-coloured Category columns or white Text columns). If this occurs, you can usually manually convert fields (columns) containing numbers or dates and times using the Data > Manage fields [19]dialog. For more information on formatting dates and times and managing time zones, see the section on Dates & Times [58].
Go to Data Management Phase [34]
This checklist covers tasks you should perform AFTER importing a data set (or merging in another) for the first time, but BEFORE adding further content or beginning to analyse how to filter, visualise or present the data.
The Data Management phase focuses on data set completeness and correctness. Data typing assumptions made by Omniscope on import should be checked, columns duplicated, expanded, collapsed or tokenized to facilitate end-user interaction with your file. In this phase, 'data scrubbing' view configurations (rather than final presentational views and layouts) are used, normally working on a single tab entitled 'Data Set' or similar. Use Table View column sorting and the Chart View to examine extreme values in each column, correct null (blank) and missing values, and add related content to the file, such as image sets, maps and links to related web pages and web services.
Using the X in the upper right-hand corner, close all the default opening Views on the opening Tab, except for the Table View [21].
2-01 Check data typing [19] - On import, Omniscope assigns a data typing assumptions to each column in the data set: 'Text', 'Numeric' or 'Date & Time'. If the number of unique text values in a column is less than a defined threshold, the field will be further typed 'Category'. Sometimes, columns of identification numbers which are not used in calculations and usually searched as Text are mistakenly typed 'Integer Number' with separators added. Data typing can be reviewed and changed using the Data > Manage fields [19] dialog. Make sure to remove the separators from numbers before changing them to text by unticking Data > Manage fields > {column} Options > Show thousands separator. Ensure that data which is stored in the source file as a valid data and time has been recogised and imported as Date and Time rather than Text, as discussed here [58].
2-02 Set default global column order [19] - the order of the columns on import may not be the most useful to your users. You can set the global default column order for the file from the Data > Manage fields [19]dialog by dragging the 'hands at the far right upwards or downwards. Column order is view specific, and you can modify the order in each Table View by dragging the columns. Use Data > Manage fields > Reset view field orders to reset columns to the default order. If you have defined tab-specific view orders, Omniscope will ask if you want to return all tabs to the global default order.
2-03 Add new fields [19] - you may want to add new fields in order to add more data. Use Data > Manage fields > Add new field to create the field at the bottom of the list, then drag the new column into proper position in the defualt column order and assign it a name. You can convert it to a formula field and define the calculation logic later.
2-00 Address null (blank) values - Omniscope is a powerful tool for completing data sets and improving data quality.
2-00 Expand, collapse or tokenize columns -
Note: Expanding and collapsing columns are data edits that will not survive a data refresh. If the changes are to be made persistent, they should be made in the source data.
2-00 Look for aberrant values -
Note: Data deletions and corrections will not survive a data refresh. If the changes are to be made persistent across refreshes, the changes should also be made in the source data.
2-00 Import image sets -
2-00 Download/import maps [54] -
2-00 Define links -
Commit all changes Tab > Commit changes for all and File > Save (Ctrl+S) the file, preserving the link to the source data if required for subsequent refresh.
At the end of this phase, the single 'DataSet' tab should reveal all non-empty and non-uniform data fields and filters (use both Sidebars if necessary to see all the filter devices) in the Table/Chart View(s) without aggregations or groupings.
Note: it is good practise to always leave this 'Data Set' tab accessible as the final tab on the far right of the file tab set, providing an instant, credibility-enhancing view of the data at maximum granularity to any user who clicks on the tab.
This checklist covers tasks you should perform, or options you should consider, AFTER you have imported/merged all the data sources and 'scrubbed' the data to ensure correctness and completeness, but BEFORE you begin to define the best ways to visualise and present the data set.
In this phase, column re-naming should be used to shorten names to save space and make them instantly meaningful to the end-user audience. Unneeded columns (especially empty or uniform-value columns) can be hidden or deleted, and the number of unique category values can be reduced, either via re-naming/consolidating values with data edits, or by adding formula columns that re-categorise records into fewer categories. Aggregations can be set and aggregation formulae specified to create transformed views of the data for use with most views.
Close the Chart View (if still open after scrubbing) and continue working initially with a single Table View [21] on a single 'Data set' tab
3-01 Rename fields/columns [56] - horizontal space is always at a premium in Omniscope and DataPlayer files, so changing/shortening the field names used in the source databases to shorter names meaningful to the intended audience not only communicates better, but also presents better. You can enable multi-line display of field (column) names in the Table View from Table View: View Tools > Column options > Column header height. Insert a "\" character when renaming field names to introduce custom line breaks, which will appear in Table View column headers (assuming multi-line headers are enabled) and also in filter devices displayed on the Sidebar.
3-02 Hide or delete fields/columns [19] - empty, uniform value and fields not needed by end users for filtering can be globally hidden or deleted using Data > Manage fields [19]. Deletions are a remembered action, and will be re-performed on every file refresh. Values in hidden columns can still be displayed in details and used in Sidebar filters and links.
3-03 Define formula fields [59] - Formula fields are used to transform imported data into new columns containing more useful, calculated values and to detect alert conditions to be highlighted. If you use formulae to make calculations, convert/reduce total category values, or to extract useful data fields from within text strings, your changes will be re-evaluated on every refresh. Formula fields can be added from the Main Toolbar: Data > Formulas command, the Manage fields [19] dialog, or the Table View: View Toolbar: Formulas drop down. [21] Functions available for use in formulae are documented in the Functions Guide [60]. This page lists useful formulae [61] commonly used in Omniscope. You may need to use Subset functions [62] unique to Omniscope to define formulae involving defined subsets of the data.
3-04 Duplicate/re-format selected fields - sometimes it is useful to duplicate a data/formula field (column) so that each can be typed two different ways to facilitate use of different filter types, often while allowing one of the columns to also be used as a splitting category. For example, the display format and data typing of Dates & Times sometimes needs to be changed so that the values sort better as categories or otherwise better facilitate user interactions. To create a duplicate of a given column, right-click {Column Header} > Tools > Create duplicate of this field.
3-05 Order Sidebar devices - if it is not already visible, reveal the Right Sidebar using Main Toolbar: Toolbars > Right Sidebar and its Devices drop down. Using the dragging 'hands' (or by dragging the Device headers themselves) set the display order by dragging various devices upwards or downwards. Now also open the Left Sidebar and its Devices drop down. Starting from the bottom, check the empty devices boxes to move the devices from the Right Sidebar to the Left Sidebar.
3-06 Define Named Queries/subsets [63] - In addition to the 'Data Set' tab already configured, create a new tab from the current layout and name it 'Defined Subsets' or similar. The new tab should show a Table View and one or both Sidebars should still be displaying all the relevant filters just as they are on the 'Data Set' tab from which this tab was derived. Use the Sidebar filters to select a useful subset of the data, then define and name the results of these filter settings as a persistent Named Query (data subset) using Main Toolbar: Queries > Create queries from filters. Confirm that your Named Query has appeared at the top of the MainToolbar Queries listing and on the bottom of the Data Subset selector drop-down on the Table View View Toolbar. Perform a Main Toolbar: Reset, then choose another combination of filters and create another Named Query subset.
3-07 Define aggregations [64] - use the Aggregate drop-down menu to define & check aggregations, specifying the aggregation functions to be applied in each column. For formula fields, consider whether it is appropriate to apply the formula to the aggregated values.
Commit all your changes using Main Toolbar: Tab > Commit changes for all, then File > Save (Ctrl+S) to save the file.
At the end of this phase, all the data, images, maps and link references required to meet end-users' requirements should be in the file, and the single 'Data Set' tab should show all the columns, both data and formula, which have not been globally hidden. Separate 'Subset', 'Formula' and 'Aggregated' tabs should be used to show useful data subsets made reference-able as Named Queries, the inputs and results from defined Formulae, and various Aggregation settings with key values calculated according to specified aggregation functions displayed. Don't worry, you can delete all these tabs in the next phase.
Go to Visualisation Phase [36]
This checklist covers tasks your should perform, or options you should consider, AFTER you have optimised your data set, defined reference-able data subsets i.e. Named Queries, added Formula fields that calculate useful values and alert conditions, and defined useful Aggregation settings (including aggregation functions by field/column), but BEFORE you decide the optimal combinations of views that best suit the requirements of the file.
Omniscope offers a large and growing number of views, each of which is highly configurable. In the Visualisation phase, you test each View on its own tab, seeking the best configuration(s) of each view for the data set and the requirements of your intended audience. You may create more than one variant of each view. Views determined to be of limited value to the audience can be hidden.
The default opening settings for each view will be defined, and the paning and field selection drop-down menus edited so that only useful options are presented to the end user in each view.
In this phase, the focus is on making best use of the various views for visualisation and navigation.
4-00
4-01 Table View [21]: In addtion to the 'Data Set' tab you have been working on, create a new tab [65] called 'Table View' which will be used to experiment with the presentational aspects of the Table View using Grouping and the various settings for the overall Summary Row.
Commit changes to the tab using the drop down at right of tab, or from Main Toolbar:Tab > Commit changes
4-02 Chart View: [22]
Commit changes to the tab using the drop down at right of tab, or from Main Toolbar:Tab > Commit changes
4-03 Pie View: [66] Define multiple pies with different combinations of Value and Split-by settings...experiment with horizontal and vertical paning, save best/most useful visualisations on tab called Pie Views or similar.
Commit changes to the tab using the drop down at right of tab, or from Main Toolbar:Tab > Commit changes
4-04 Bar View: [67]
Commit changes to the tab using the drop down at right of tab, or from Main Toolbar:Tab > Commit changes
4-05 Graph View [68]:
Commit changes to the tab using the drop down at right of tab, or from Main Toolbar:Tab > Commit changes
4-06 Tile View [69]:
Commit changes to the tab using the drop down at right of tab, or from Main Toolbar:Tab > Commit changes
4-07 Pivot View [70]:
Commit changes to the tab using the drop down at right of tab, or from Main Toolbar:Tab > Commit changes
4-08 Network View: [71]
Commit changes to the tab using the drop down at right of tab, or from Main Toolbar:Tab > Commit changes
4-09 Portal View: [72]
Commit changes to the tab using the drop down at right of tab, or from Main Toolbar:Tab > Commit changes
4-10 Map View: [73]
Commit changes to the tab using the drop down at right of tab, or from Main Toolbar:Tab > Commit changes
4-11 Venn View: [74]
Commit changes to the tab using the drop down at right of tab, or from Main Toolbar:Tab > Commit changes
4-12 Dial View [75]:
Commit changes to the tab using the drop down at right of tab, or from Main Toolbar:Tab > Commit changes
4-13 Content View: [76]
Commit changes to the tab using the drop down at right of tab, or from Main Toolbar:Tab > Commit changes
4-14 Web View: [77]
Commit changes to the tab using the drop down at right of tab, or from Main Toolbar:Tab > Commit changes
4-15 Details View: [78]
Commit changes to the tab using the drop down at right of tab, or from Main Toolbar:Tab > Commit changes
4-16 DataPlayer View: [79]
Commit changes to the tab using the drop down at right of tab, or from Main Toolbar:Tab > Commit changes
Commit all changes Main Toolbar: Tab > Commit changes for all and File > Save (Ctrl+S) the file, preserving the link to the source data if required.
At the end of this phase, you should have a tab for each view you plan to use, with one or more variations of the view on each tab, perhaps some displaying subsets of the data defined by Named Queries, and others displaying aggregated data and functions as defined in the Aggregation settings in the view(s).
This checklist covers tasks your should perform, or options you should consider, AFTER you have defined the views you plan to use, but BEFORE you create the tab sequence that will convert your file into a final presentation. Most of the tasks in this phase are documented in the Reports & Presentations [50] chapter of the User Guide.
Unlike previous phases, the Presentation phase takes a minimalist, 'zero-based' approach to file configuration, i.e. the bias is that everything should be hidden unless it is needed on a specific tab to make a specific point or enable a particular end-user interaction. Working with the most useful view configurations created in the previous phase, the objective of this phase is to create a multi-tabbed presentation where each tab is addressed to a specific issue with a specific message supported by the data. In this phase the philosophy is 'less is more' to simplify the audience experience, but with credibility-building granular detail always only one click away.
At this point your file consists of view-specific tabs and perhaps some other tabs created in previous phases. Starting with the most useful view-specific tabs, you will now create multi-view versions of each tab, combining efffective views/data subsets and re-naming the tabs to focus on messages and user groups. Don't be afraid to create many different new tabs, each focused on specific user groups and points to be made, rather than trying to put too much on one or two tabs. The objective is to create a file that opens and navigates just like a slide presentation.
5-00 Add titles and annotations [80] - add titles and annotations to each tab, styling and sizing the text and adjusting spacing between views, using the commands available from the Main Toolbar: Layout > View Spacing, Titles, and Annotations [81]
5-00 Select & Edit layout modes [82] - choose the Layout mode you wish to apply to each tab in your file, making edits to the default modes, or adding new modes of your own.
5-00 Select & Edit Styles [83] - use default styles suited to each Layout mode, or create a new Style to match your corporate standards.
5-00 Specify tab toolbar defaults [84] - set the tab-specific visibility of various toolbars and other on-screen tab navigation and filtering aids.
5-00 Hide user options in drop-downs [85] - the filed (column) options available to the end user should be reuded to the minimun useful set by toggling the Show' option revealed by clicking on the spanner/wrench on each drop-down header. Toggle the 'All' option to hide the filed from all drop-downs on th same tab. This operation is tab-specific.
Note: any of the experimental view-specific visualisation tabs created in the previous Visualisation phase can now be deleted in favour of new, message-oriented tabs in the presentation.
Order tabs, commit all changes & save - make sure that your desired opening tab is open, then commit all changes using Main Toolbar: Tab > Commit changes for all and File > Save (Ctrl+S) the file, preserving the link to the source data and merge history if required.
In the Publishing phase, we focus on final file configuration options relating to branding, data refresh and how others will be able to use the file. Help screens are added, along with selected branding options (opening screen, closing screen, banner ads, corner logos, etc.). File settings relating to refresh, file security, and other options configured in the file when saved are all considered in this final phase.
6-00 Create help page - this pop-up screen is accessible from the Main Toolbar 'Help with this file' icon at the far right, as well as from the Help > Help with this file
6-00 Create cover page - this opening screen
6-00 Create back page - this closing screen is displayed for a designated period of time when the file is closed.
Make sure that the opening tab is open, then commit all changes from Main Toolbar: Tab > Commit changes for all and then File > Save (Ctrl+S) the file, preserving the links to the source data and merge history if required.
Links:
[1] http://kb.visokio.com/kb
[2] http://kb.visokio.com/configuration-checklist
[3] http://kb.visokio.com/overview
[4] http://kb.visokio.com/installation
[5] http://kb.visokio.com/kb/mac-installs
[6] http://kb.visokio.com/getomniscope
[7] http://kb.visokio.com/kb/cmdline
[8] http://kb.visokio.com/kb/non-windows-installs
[9] http://kb.visokio.com/activation
[10] http://kb.visokio.com/welcome-screen
[11] http://kb.visokio.com/using-viewer
[12] http://kb.visokio.com/file-open-demo
[13] http://kb.visokio.com/demos
[14] http://kb.visokio.com/scaling-and-performance
[15] http://kb.visokio.com/files/Resources/OUGuide/222_QuickGuide/Hurricanes_of_2003.csv
[16] http://kb.visokio.com/files/Resources/Common-Visokio/annotated_spreadsheet.png
[17] http://kb.visokio.com/file-open
[18] http://kb.visokio.com/importing-data
[19] http://kb.visokio.com/manage-fields
[20] http://kb.visokio.com/files/Resources/OUGuide/222_QuickGuide/222_TableAgg_800x600.jpg
[21] http://kb.visokio.com/table-view
[22] http://kb.visokio.com/chart-view
[23] http://kb.visokio.com/report-pages
[24] http://kb.visokio.com/kb/64-bit-configuration
[25] http://kb.visokio.com/using-omniscope-online
[26] http://kb.visokio.com/omniscope-licensing
[27] http://kb.visokio.com/files/Resources/OUGuide/558_GettingStarted/23_Installation/23_ProxyConfigInputs_371x219.png
[28] http://kb.visokio.com/node/236
[29] http://kb.visokio.com/kb/automation-options
[30] http://kb.visokio.com/kb/windows-service
[31] http://kb.visokio.com/kb/installation
[32] http://kb.visokio.com/translations-guide
[33] http://kb.visokio.com/import-data-phase
[34] http://kb.visokio.com/data-mgt-phase
[35] http://kb.visokio.com/analysis-phase
[36] http://kb.visokio.com/visualisation-phase
[37] http://kb.visokio.com/presentation-phase
[38] http://kb.visokio.com/publication-phase
[39] http://kb.visokio.com/xmldata
[40] http://kb.visokio.com/using-data-manager
[41] http://kb.visokio.com/create-new-file
[42] http://kb.visokio.com/connect-to-database
[43] http://kb.visokio.com/using-connectors
[44] http://kb.visokio.com/kb/data-file-formats
[45] http://kb.visokio.com/kb/dbconnections
[46] http://kb.visokio.com/editing-data
[47] http://kb.visokio.com/managing-data
[48] http://kb.visokio.com/configure-file
[49] http://kb.visokio.com/exploring-data
[50] http://kb.visokio.com/reports-presentations
[51] http://kb.visokio.com/saving-exporting
[52] http://kb.visokio.com/open-image-set
[53] http://kb.visokio.com/open-folder
[54] http://kb.visokio.com/file-open-map
[55] http://kb.visokio.com/maps
[56] http://kb.visokio.com/merge-data
[57] http://kb.visokio.com/node/246
[58] http://kb.visokio.com/dates-and-times
[59] http://kb.visokio.com/formulas-variables
[60] http://kb.visokio.com/kb/functions-guide
[61] http://kb.visokio.com/kb/useful-formulae
[62] http://kb.visokio.com/kb/subset-functions
[63] http://kb.visokio.com/queries-subsets
[64] http://kb.visokio.com/aggregate-data
[65] http://kb.visokio.com/managing-tabs
[66] http://kb.visokio.com/pie-view
[67] http://kb.visokio.com/bar-view
[68] http://kb.visokio.com/graph-view
[69] http://kb.visokio.com/tile-view
[70] http://kb.visokio.com/pivot-view
[71] http://kb.visokio.com/network-view
[72] http://kb.visokio.com/portal-view
[73] http://kb.visokio.com/map-view
[74] http://kb.visokio.com/venn-view
[75] http://kb.visokio.com/dial-view
[76] http://kb.visokio.com/content-view
[77] http://kb.visokio.com/web-view
[78] http://kb.visokio.com/details-view
[79] http://kb.visokio.com/dataplayer-view
[80] http://kb.visokio.com/managing-tab-layouts
[81] http://kb.visokio.com/layout-menu
[82] http://kb.visokio.com/edit-layout-modes
[83] http://kb.visokio.com/configuring-styles
[84] http://kb.visokio.com/toolbar-menu
[85] http://kb.visokio.com/using-drop-downs