Below is an index to all the drop-down command menus accessed from the Main Toolbar [1] for version 2.5. For information on commands and options related to specific Views and View Toolbars, please consult the Guide to Views. [2] If you're still using version 2.4, please see the command reference for 2.4 [3]. If you're accustomed to Omniscope 2.4, and can't find a command in version 2.5, see this guide to changes [4].
Main Toolbar Commands - version 2.5
Click for an overview of the Main Toolbar in version 2.5 [1] Click on the links below for more detail on the section containing the command(s) you are seeking. |File [5]|Data [6] |Tab [7] |Layout [8] |Toolbars [9] |Settings [10] |Help [11]| | |
 | File menu [5]
|
 | Data menu [6]Manage fields |
 | Tab menu [7]New [7] |
 | Layout menu [8]Mode selection: [8] Working mode-------------------------- |
 | Toolbars menu [9]Toolbar visibility: |
 | Settings menu [10]This tab: [10] |
 | Help menu [11]Help with this file - |
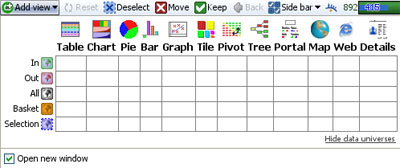
The Omniscope Main Toolbar contains both a series of drop-down command menus on the left and a selection of navigational command icons and functions to the right of the command menus used to explore and refresh Omniscope files. The command menu options on the Main Toolbar are generally not needed to navigate Omniscope files prepared by others. The number of icons and detail displayed will depend on the horizontal space available to Omniscope. Various Layout modes may hide the Main Toolbar unless the user hovers their mouse near the top of the display.
![]()
| Add View - opens a new View window | |||
| Reset - returns all records to the filtered IN subset | Working Mode - layout for configuring files | ||
| Deselect - removes all selections | Presentation Mode - layout for presentations | ||
| Move - selected records to the filtered OUT subset | Reporting Mode - layout for printing | ||
| Keep - selected records in the filtered IN subset | Dashboard Mode - layout for refreshable displays | ||
| Back - to the previous display | Zoom - adjusts display resolution/font size | ||
| Colour by - choose global colouring option | Help page - launches file-specific help screen | ||
| Details - display field values for selected record set | File close - closes the open file | ||
OUT (174), and Selected (1) record (row) counts | Expand/Show Labels - expands and wraps Main Toolbar to display labels | ||
See the section below for more detail on Main Toolbar commands
The left side of the Main Toolbar contains all the top-level command menus. When no Omniscope data file is loaded, the Main Toolbar displays only these command menus and the Welcome Screen [27]. File menu [5]: importing/refreshing, saving, exporting and printing data, maps and image sets. Data menu [6]: managing data columns (fields) and values within categories, adding new columns & rows and changing data orientation (de-pivot and re-pivot). Tab menu: [7] enable auto-refresh, change languages, set details display options, define links, image sets and web services related to the file. Layout menu: [8] create, modify and navigate Report pages. Toolbars menu: [28] modify aspects of the workspace or current Report page. Settings menu: [10] add branding and modify/simplify most aspects of the colouring, look and feel of the file. Help menu: [11] create file-specific help screen, access learning resources, send bug reports/suggestions, check for updates and licensing status (if these services are not working, consult the KnowledgeBase section on Proxy Settings [29]).
Complete documentation of all the commands on these menus can be accessed from the Commands Reference [30] page or by following the links above. | Add View menu: |
| |||||||||||||||||||||||
Reset - Omniscope files contain flat tables of structured data organised into records (rows) and fields (columns). Navigating an Omniscope file usually involves either setting Side Bar filters, or Selecting plus either Move or Keep operations to focus on only a certain data subset. The Reset button removes all of the filtering criteria you may have expressed, and returns the current display views to show all the records in the Filtered IN universe. It is very important to always Reset your data before filtering, so that all qualifying records will be considered in your subsequent query. Unless you configure them otherwise, tabs remember their queries/data subsets, so if you want a Report Page to open showing all the data, make sure to Reset all the filters and commit the changes before you save the file. Note: On the Side Bar filter devices it is possible to reset each filter individually, and if a Side Bar filter device is set to Freeze, that filter's settings will survive a global Reset. | ||
Deselect - Removes all records from the Selected data subset and greys-out the option to do Move or Keep operations on selected records. Omniscope power query filtering directly on views (as opposed to Side Bar filtering) involves 4 basic mouse operations: Select (or Deselect), followed by Move or Keep, and then perhaps a Reset. Every view provides ways of selecting one or more records using just the mouse. In most views, you can also Deselect by clicking again on one or more of the selected areas or groups of records. It is not necessary to use this global Deselect on the Main Toolbar unless you wish to clear all selections made simultaneously. | ||
| Move - Selecting records is a precursor to deciding whether to Move the selected records, i.e. filtered OUT of further consideration. If you are working from a view of the filtered IN data subset, the grey Move command moves all selected records OUT of consideration, where they stay until they are returned or the display is Reset. The barometer will give you a preview of this on the left side, where selected IN records to be moved will be highlighted. If you are working from the filtered OUT data subset, the display will change the colour of the Move icon to blue, since moving records from the filtered OUT subset will return them to the filtered IN subset. The barometer will show you the selected OUT records highlighted on the right side. If you are working from a view set to display ALL Data, the barometer will show you the effect of Moves and Keeps, but that specific view will not update as a result, since views showing ALL Data always display all records regardless of whether they are filtered IN or OUT. | ||
| Keep- the opposite of Move, the Keep command keeps only the selected records in the filtered IN subset, and moves all other unselected records to the filtered OUT subset. If you are working from a view displaying the filtered OUT subset, the Keep icon will change colour to grey, since the effect will be toKeep the selected records in the filtered OUT subset. If you are working from a view set to display ALL Data, the barometer will show you the effect of Moves and Keeps, but that specific view will not update as a result, since views showing ALL Data always display all records regardless of whether they are filtered IN or OUT. | ||
| Back- similar to a browser, if you have performed a filtering operation, you can go back to the previous query state(s) at any time by pressing the Back button. | ||
| ||
| Queries - this drop-down menu is used to manage defined data subsets associated with Named Queries. Using this menu you can name empty queries ( e.g "Basket" or "Errors") to collect records you add, or you can define complex queries as re-usable Named Queries using patterns of Side Bar filter settings. Each Named Query defined is added to the data subsets that can be displayed in most views. Detailed documentation of the use of the commands on this menu is here [47]. | ||
| Barometer - this very useful indicator depicts the top level query state (records IN and OUT, with currently selected subsets counts) at any given time. In this example, the data set contains 4,886 total records (rows), of which 4,292 remain in the filtered IN subset, and 594 have been moved to the filtered OUT subset. In addition, 1,719 records have been selected, and the currently highlighted single record is among those selected. Always keep an eye on the barometer before initiating new filtering/queries to ensure that you have Reset (or gone Back) to the correct IN subset. | ||
| Auto-refresh settings - Omniscope files can have other Omniscope files as data sources. Activated Omniscopes can refresh the data in an open .IOK/.IOM file from the data in another .IOK/.IOM file accessible over a network. The Auto-refresh drop down menu is revealed by activating the Automatic refresh option from the Tools menu [48]. Once revealed, this menu allows all aspects of the refresh process to be configured, as described here. [49] There is an option to display a Pause/Resume button (see below). | ||
| Pause/Resume (auto-refresh)- Auto-refresh settings options include displaying a Pause/Resume auto-refresh button on the Main Toolbar. | ||
| | File-specific help screen - click to what the owner of a given file may have written to help users understand more about the file. If you are configuring a file for others, the content of this screen is composed from Help > Edit Help screen. | |
| Corner logo - if you are publishing or re-publishing .IOK/.IOM files, you can replace this logo and link with your own. See Appearance > Branding > Add Corner Logo and Set Publisher link (for best results, use a logo 19 pixels high). | ||
| Close file - click here to close the .IOK/.IOM file currently open. Once the data file is closed, the screen will display the Omniscope opening desktop, which includes links to previously opened files, as well as learning resources, embedded demos and other useful resources. | ||
Relates only to version 2.4
The Omniscope Main Toolbar contains both a series of drop-down command menus on the left and a selection of navigational command icons and functions used to explore and refresh Omniscope files to the right of the command menus. The command menu options are generally not needed to navigate Omniscope files prepared by others.
![]()
Immediately to the right of the Help command is the Add View drop down menu, used to add an additional view to the current display. To remove a view from the display, click on the [X] in the upper right hand corner of the view. To change a window from one view to another, click on the view name and select the view you want from the drop-down menu. If you want to add a view showing another data subset, you can select it using the Data Subset drop-down to the right of the view name in each View Toolbar.There is no upper limit on the number of views you can open in Omniscope, but display screen size limitations encourage using multiple tabbed Report Pages to display different combinations of views, rather than crowding the working display with too many open views. More on creating Report Pages [50].
| File [51]| Edit [52] | Tools [53] | Reports [54] | Page [55] | Appearance [56]| Help [57] | The left side of the Main Toolbar contains all the top-level command menus. When no .IOK/.IOM data file is loaded, the Main Toolbar displays only the command menus. File menu [51]: importing/refreshing, saving, exporting and printing data, maps and image sets. Edit menu: [52] managing data columns (fields) and values within categories, adding new columns & rows and changing data orientation (de-pivot and re-pivot). Tools menu: [53] enable auto-refresh, change languages, set details display options, define links, image sets and web services related to the file. Reports menu: [54] create, modify and navigate Report pages. Page menu: [55] modify aspects of the workspace or current Report page. Appearance menu: [56] add branding and modify/simplify most aspects of the colouring, look and feel of the file. Help menu: [57] create file-specific help screen, access learning resources, send bug reports/suggestions, check for updates and licensing status.
Complete documentation of all the commands on these menus can be accessed from the Commands Reference 2.4 [3] page or by following the links above. | Add View menu: |
|
Whenever a data file is loaded, to the right of the command menus, the Main Toolbar also displays a selection of navigational command icons and functions used to explore and refresh Omniscope files:
![]() Reset - Omniscope files contain flat tables of structured data organised into records (rows) and fields (columns). Navigating an Omniscope file usually involves either setting Side Bar filters, or Selecting plus either Move or Keep operations to focus on only a certain data subset. The Reset button removes all of the filtering criteria you may have expressed, and returns the current display views to show all the records in the Filtered IN universe. It is very important to always Resetyour data before filtering, so that all qualifying records will be considered in your subsequent query. Unless you configure them otherwise, Report Pages remember their queries/data subsets, so if you want a Report Page to open showing all the data, make sure to Reset all the filters and commit the changes before you save the file. Note: On the Side Bar filter devices it is possible to reset each filter individually, and if a Side Bar filter device is set to Freeze, that filter's settings will survive a globalReset.
Reset - Omniscope files contain flat tables of structured data organised into records (rows) and fields (columns). Navigating an Omniscope file usually involves either setting Side Bar filters, or Selecting plus either Move or Keep operations to focus on only a certain data subset. The Reset button removes all of the filtering criteria you may have expressed, and returns the current display views to show all the records in the Filtered IN universe. It is very important to always Resetyour data before filtering, so that all qualifying records will be considered in your subsequent query. Unless you configure them otherwise, Report Pages remember their queries/data subsets, so if you want a Report Page to open showing all the data, make sure to Reset all the filters and commit the changes before you save the file. Note: On the Side Bar filter devices it is possible to reset each filter individually, and if a Side Bar filter device is set to Freeze, that filter's settings will survive a globalReset.
![]() Deselect - Removes all records from the Selected data subset and greys-out the option to do Move or Keep operations on selected records. Omniscope power query filtering directly on views (as opposed to Side Bar filtering) involves 4 basic mouse operations: Select (or Deselect), followed by Move or Keep, and then perhaps a Reset. Every view provides ways of selecting one or more records using just the mouse. In most views, you can also Deselect by clicking again on one or more of the selected areas or groups of records. It is not necessary to use this global Deselect on the Main Toolbar unless you wish to clear all selections made simultaneously.
Deselect - Removes all records from the Selected data subset and greys-out the option to do Move or Keep operations on selected records. Omniscope power query filtering directly on views (as opposed to Side Bar filtering) involves 4 basic mouse operations: Select (or Deselect), followed by Move or Keep, and then perhaps a Reset. Every view provides ways of selecting one or more records using just the mouse. In most views, you can also Deselect by clicking again on one or more of the selected areas or groups of records. It is not necessary to use this global Deselect on the Main Toolbar unless you wish to clear all selections made simultaneously.
![]() Move - Selecting records is a precursor to deciding whether to Move the selected records, i.e. filtered OUT of further consideration. If you are working from a view of the filtered IN data subset, the grey Move command moves all selected records OUT of consideration, where they stay until they are returned or the display is Reset. The barometer will give you a preview of this on the left side, where selected IN records to be moved will be highlighted. If you are working from the filtered OUT data subset, the display will change the colour of the Move icon to blue, since moving records from the filtered OUT subset will return them to the filteredIN subset. The barometer will show you the selected OUT records highlighted on the right side. If you are working from a view set to display ALL Data, the barometer will show you the effect of Moves and Keeps, but that specific view will not update as a result, since views showing ALL Data always display all records regardless of whether they are filtered IN or OUT.
Move - Selecting records is a precursor to deciding whether to Move the selected records, i.e. filtered OUT of further consideration. If you are working from a view of the filtered IN data subset, the grey Move command moves all selected records OUT of consideration, where they stay until they are returned or the display is Reset. The barometer will give you a preview of this on the left side, where selected IN records to be moved will be highlighted. If you are working from the filtered OUT data subset, the display will change the colour of the Move icon to blue, since moving records from the filtered OUT subset will return them to the filteredIN subset. The barometer will show you the selected OUT records highlighted on the right side. If you are working from a view set to display ALL Data, the barometer will show you the effect of Moves and Keeps, but that specific view will not update as a result, since views showing ALL Data always display all records regardless of whether they are filtered IN or OUT.
![]() Keep - the opposite of Move, the Keep command keeps only the selected records in the filtered IN subset, and moves all other unselected records to the filtered OUT subset. If you are working from a view displaying the filtered OUT subset, the Keep icon will change colour to grey, since the effect will be toKeep the selected records in the filtered OUT subset. If you are working from a view set to display ALL Data, the barometer will show you the effect of Moves andKeeps, but that specific view will not update as a result, since views showing ALL Data always display all records regardless of whether they are filtered IN or OUT.
Keep - the opposite of Move, the Keep command keeps only the selected records in the filtered IN subset, and moves all other unselected records to the filtered OUT subset. If you are working from a view displaying the filtered OUT subset, the Keep icon will change colour to grey, since the effect will be toKeep the selected records in the filtered OUT subset. If you are working from a view set to display ALL Data, the barometer will show you the effect of Moves andKeeps, but that specific view will not update as a result, since views showing ALL Data always display all records regardless of whether they are filtered IN or OUT.
![]() Back - similar to a browser, if you have performed a filtering operation, you can go back to the previous query state(s) at any time by pressing the Back button.
Back - similar to a browser, if you have performed a filtering operation, you can go back to the previous query state(s) at any time by pressing the Back button.
![]() Controls - this drop-down menu controls display of the two Sidebars, as well as the Cycling Toolbar. For more detail, see the Controls [59] subsection.
Controls - this drop-down menu controls display of the two Sidebars, as well as the Cycling Toolbar. For more detail, see the Controls [59] subsection.
![]() Barometer - this very useful indicator depicts the top level query state (records IN and OUT, with currently selected subsets counts) at any given time. In this example, the data set contains 4,886 total records (rows), of which 4,292 remain in the filtered IN subset, and 594 have been moved to the filtered OUT subset. In addition, 1,719 records have been selected, and the currently highlighted single record is among those selected. Always keep an eye on the barometer before initiating new filtering/queries to ensure that you have Reset (or gone Back) to the correct IN subset.
Barometer - this very useful indicator depicts the top level query state (records IN and OUT, with currently selected subsets counts) at any given time. In this example, the data set contains 4,886 total records (rows), of which 4,292 remain in the filtered IN subset, and 594 have been moved to the filtered OUT subset. In addition, 1,719 records have been selected, and the currently highlighted single record is among those selected. Always keep an eye on the barometer before initiating new filtering/queries to ensure that you have Reset (or gone Back) to the correct IN subset.
![]() Queries - this drop-down menu is used to manage defined data subsets associated with Named Queries. Using this menu you can name empty queries ( e.g "Basket" or "Errors") to collect records you add, or you can define complex queries as re-usable Named Queries using patterns of Side Bar filter settings. Each Named Query defined is added to the data subsets that can be displayed in most views. Detailled documentation of the use of the commands on this menu is here [47].
Queries - this drop-down menu is used to manage defined data subsets associated with Named Queries. Using this menu you can name empty queries ( e.g "Basket" or "Errors") to collect records you add, or you can define complex queries as re-usable Named Queries using patterns of Side Bar filter settings. Each Named Query defined is added to the data subsets that can be displayed in most views. Detailled documentation of the use of the commands on this menu is here [47].
![]() Auto-refresh settings - Omniscope files can have other Omniscope files as data sources. Activated Omniscopes can refresh the data in an open .IOK/.IOM file from the data in another .IOK/.IOM file accessible over a network. The Auto-refresh drop down menu is revealed by activating the Automatic refresh option from the Tools menu [48]. Once revealed, this menu allows all aspects of the refresh process to be configured, as described here. [49] There is also an option to display a Pause/Resume button (see below).
Auto-refresh settings - Omniscope files can have other Omniscope files as data sources. Activated Omniscopes can refresh the data in an open .IOK/.IOM file from the data in another .IOK/.IOM file accessible over a network. The Auto-refresh drop down menu is revealed by activating the Automatic refresh option from the Tools menu [48]. Once revealed, this menu allows all aspects of the refresh process to be configured, as described here. [49] There is also an option to display a Pause/Resume button (see below).
![]() Pause/Resume (auto-refresh) - Auto-refresh settings options include displaying a Pause/Resume auto-refresh button on the Main Toolbar.
Pause/Resume (auto-refresh) - Auto-refresh settings options include displaying a Pause/Resume auto-refresh button on the Main Toolbar.
![]() File-specific help screen - click on this help icon to see what the publisher or re-publisher of a given file may have written to help users understand more about the file. If you are configuring a file for others, the content of this screen may be composed from Help > Edit Help screen.
File-specific help screen - click on this help icon to see what the publisher or re-publisher of a given file may have written to help users understand more about the file. If you are configuring a file for others, the content of this screen may be composed from Help > Edit Help screen.
![]() Corner logo - if you are publishing or re-publishing .IOK/.IOM files, you can replace this logo and link with your own. See Appearance > Branding > Add Corner Logo and Set Publisher link (for best results, use a logo 19 pixels high).
Corner logo - if you are publishing or re-publishing .IOK/.IOM files, you can replace this logo and link with your own. See Appearance > Branding > Add Corner Logo and Set Publisher link (for best results, use a logo 19 pixels high).
![]() Close file - click here to close the Omniscope file currently open. Once the data file is closed, the screen will display the Omniscope opening desktop, which includes links to previously opened files, as well as learning resources, embedded demos and other useful resources.
Close file - click here to close the Omniscope file currently open. Once the data file is closed, the screen will display the Omniscope opening desktop, which includes links to previously opened files, as well as learning resources, embedded demos and other useful resources.
Relates only to version 2.4 and prior
The Controls drop-down menu is located on the Main Toolbar to the left of the Barometer.
Show right/left Sidebar - displays one or both Side Bars. By default, all filter Devices are initially displayed on the right side bar. To move filter Devices to the left Side Bar, open the left Side Bar and use the Devices drop down on the left Side Bar to tick which devices you want to move from the right to left Side Bar. Using Side Bars [60] Auto-hide main toolbar - ticking this option will cause the Main Toolbar to retract for all Report Tabs and the workspace, unless the mouse is hovered above the Report tabs at the top of the screen. This is often useful when simplifying the page layout for live presentations. This option can also be set on an individual Report Page basis by unticking the Show main toolbar option at the bottom of the Page menu [61], then committing the change on each Report Page tab for which you do not want the Main Toolbar displayed. |
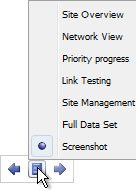
Cycling toolbar - the Cycling Toolbar contains the setting for automatically cycling through Records, Values and Reports, introducing a degree of automation in the display of the data and images in the file. When set to Hide, the Cycling Toolbar will not display. The Auto-show option will enable display of the Cycling toolbar when the mouse hovers at the bottom of the screen. The Show option will display the Cycling Toolbar at all times. Using the Cycling Toolbar [62]
Relates only to version 2.3 and earlier.
The left side of the Main Toolbar contains all the top-level command menus. When no Omniscope data file is loaded, the Main Toolbar displays only the command menus. These commands are generally not needed to navigate an Omniscope file prepared for you by someone else. Documentation of all the commands on these menus can be accessed from the Commands Reference [3] page or by following the links below:
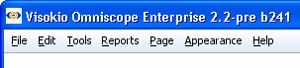
| File [63]| Edit [64] | Tools [65] | Reports [66] | Page [67] | Appearance [68]| Help [69] |
Whenever an Omniscope data file is loaded, to the right of the command menus, the Main Toolbar also displays a selection of navigational command icons and functions used to explore Omniscope files:
![]()
![]() Add View -Used to add an additional view to the current display. To remove a view from the display, click on the [X] in the upper right hand corner of the view. To change a window from one view to another, click on the view name and select the view you want from the drop-down menu. If you want to add a view showing another Universe, click on the Show other data universes option to display a grid of all views and universes. There is no upper limit on the number of views you can open in Omniscope, but display screen size limitations encourage using multiple Report Pages to display different combinations of views, rather than crowding the working display with too many open views. More on creating Report Pages [50].
Add View -Used to add an additional view to the current display. To remove a view from the display, click on the [X] in the upper right hand corner of the view. To change a window from one view to another, click on the view name and select the view you want from the drop-down menu. If you want to add a view showing another Universe, click on the Show other data universes option to display a grid of all views and universes. There is no upper limit on the number of views you can open in Omniscope, but display screen size limitations encourage using multiple Report Pages to display different combinations of views, rather than crowding the working display with too many open views. More on creating Report Pages [50].
![]() Reset - Omniscope files are flat tables of data, with records (rows) and fields (columns). One of the objectives of navigating an Omniscope file is to select and focus on only a certain subset of records (rows), rather than all the records in the file. The Reset button removes all of the filtering criteria you may have expressed, and returns the current display views to show all the records in the IN universe. It is very important to always reset your data before filtering, so that all qualifying records will be considered in your subsequent query. Unless you say otherwise, Report Pages remember their queries, so if you want a Report Page to open showing all the data, make sure to Reset the views and commit the changes before you save the file.
Reset - Omniscope files are flat tables of data, with records (rows) and fields (columns). One of the objectives of navigating an Omniscope file is to select and focus on only a certain subset of records (rows), rather than all the records in the file. The Reset button removes all of the filtering criteria you may have expressed, and returns the current display views to show all the records in the IN universe. It is very important to always reset your data before filtering, so that all qualifying records will be considered in your subsequent query. Unless you say otherwise, Report Pages remember their queries, so if you want a Report Page to open showing all the data, make sure to Reset the views and commit the changes before you save the file.
![]() Deselect - Removes all records from the blue SELECTION universe, and greys-out the option to do Move or Keep operations on selected records. Omniscope filtering using power queries depends on 4 basic operations: Select (or Deselect), followed by Move or Keep, and perhaps a Reset. Every view provides ways of selecting one or more records using just a mouse. In most views, you can also Deselect by clicking again on one or more of the selected areas or groups of records. It is not necessary to use the global Deselect on the Main Toolbar unless you wish to clear all selections.
Deselect - Removes all records from the blue SELECTION universe, and greys-out the option to do Move or Keep operations on selected records. Omniscope filtering using power queries depends on 4 basic operations: Select (or Deselect), followed by Move or Keep, and perhaps a Reset. Every view provides ways of selecting one or more records using just a mouse. In most views, you can also Deselect by clicking again on one or more of the selected areas or groups of records. It is not necessary to use the global Deselect on the Main Toolbar unless you wish to clear all selections.
![]() Move - Selecting/deselecting records is a precursor to deciding whether to Move the selected records OUT of further consideration. If you are working in the IN universe, the Move command moves all selected records OUT of consideration, where they stay until the display is Reset. If you are working from the OUT Universe, the display will change the colour of the Move icon to green, since moving records from the OUT Universe will return them to the green IN Universe. If you are working from the black ALL universe, the display will change the Move button, substituting OUT for Move, signifying that moving records from the ALL Universe places them in the OUT Universe, if they are not already there. Remember that the black ALL Universe always contains all records and does not change.
Move - Selecting/deselecting records is a precursor to deciding whether to Move the selected records OUT of further consideration. If you are working in the IN universe, the Move command moves all selected records OUT of consideration, where they stay until the display is Reset. If you are working from the OUT Universe, the display will change the colour of the Move icon to green, since moving records from the OUT Universe will return them to the green IN Universe. If you are working from the black ALL universe, the display will change the Move button, substituting OUT for Move, signifying that moving records from the ALL Universe places them in the OUT Universe, if they are not already there. Remember that the black ALL Universe always contains all records and does not change.
![]() Keep - the opposite of Move, if you are working in the IN Universe, the Keep command keeps only the selected records IN consideration, and moves all other unselected records OUT of consideration. If you are working from the OUT Universe, the display will change the colour of the Keep icon to red, since it will keep selected records in the OUT Universe and will return all others to the green IN Universe. If you are working from the black ALL Universe, the display will change the Keep button, substituting IN for Keep, signifying that keeping records from the ALL Universe places them in the IN Universe, if they are not already there. Remember that the Black ALL Universe always contains all records and does not change.
Keep - the opposite of Move, if you are working in the IN Universe, the Keep command keeps only the selected records IN consideration, and moves all other unselected records OUT of consideration. If you are working from the OUT Universe, the display will change the colour of the Keep icon to red, since it will keep selected records in the OUT Universe and will return all others to the green IN Universe. If you are working from the black ALL Universe, the display will change the Keep button, substituting IN for Keep, signifying that keeping records from the ALL Universe places them in the IN Universe, if they are not already there. Remember that the Black ALL Universe always contains all records and does not change.
![]() Back - like with a browser, you can go back to the previous display at any time by pressing Back.
Back - like with a browser, you can go back to the previous display at any time by pressing Back.
![]() Show Side Bar - clicking this icon gives you the option to show or hide the Side Bars on one or both sides of the current display. You can choose to display a Side Bar on the right, the left or both sides of the display. If you display both Side Bars, adding a device to one Side bar display will remove it from the other.
Show Side Bar - clicking this icon gives you the option to show or hide the Side Bars on one or both sides of the current display. You can choose to display a Side Bar on the right, the left or both sides of the display. If you display both Side Bars, adding a device to one Side bar display will remove it from the other.
![]() DataPlayer link - used to export data sets to Omniscope's companion application FeatureFinder (integrated as DataPlayer View in 2.4+). The separate application converts your data into interactive Flash .SWF DataPlayers suitable for embedding in web pages and offline documents such as PowerPoint, Adobe Acrobat .PDFs, Excel etc. DataPlayers in version 2.3 do not scale to more than about 5-10,000 typical records [70], so you may have to use Omniscope to divide your data set into smaller sets before exporting the data to convert as DataPlayers.
DataPlayer link - used to export data sets to Omniscope's companion application FeatureFinder (integrated as DataPlayer View in 2.4+). The separate application converts your data into interactive Flash .SWF DataPlayers suitable for embedding in web pages and offline documents such as PowerPoint, Adobe Acrobat .PDFs, Excel etc. DataPlayers in version 2.3 do not scale to more than about 5-10,000 typical records [70], so you may have to use Omniscope to divide your data set into smaller sets before exporting the data to convert as DataPlayers.
![]() Barometer - upon opening a file, it is useful to know how many records are in the data set. As you filter, it is useful to see how many records have been kept IN consideration, and how many moved OUT. The barometer is a visual gauge that shows the total, as well as the split between IN and OUT Universes. More on Data Universes [71]
Barometer - upon opening a file, it is useful to know how many records are in the data set. As you filter, it is useful to see how many records have been kept IN consideration, and how many moved OUT. The barometer is a visual gauge that shows the total, as well as the split between IN and OUT Universes. More on Data Universes [71]
![]() Basket - the basket is a 'parking place' where you can put selected records, such that they will stay there even if you Reset the display. At any time, you can open the Basket and see the records you have placed there.
Basket - the basket is a 'parking place' where you can put selected records, such that they will stay there even if you Reset the display. At any time, you can open the Basket and see the records you have placed there.
![]() Help screen - click on the help icon to see what the publisher or re-publisher of the file may have to say that will help you understand more about the file.
Help screen - click on the help icon to see what the publisher or re-publisher of the file may have to say that will help you understand more about the file.![]() Publisher logo/ link - if you are publishing or re-publishing an .IOK file, you can put your own logo here, and link it to your website. See Appearance > Branding > Add Corner Logo and Set Publisher link (for best results, use a logo 19 pixels high).
Publisher logo/ link - if you are publishing or re-publishing an .IOK file, you can put your own logo here, and link it to your website. See Appearance > Branding > Add Corner Logo and Set Publisher link (for best results, use a logo 19 pixels high).
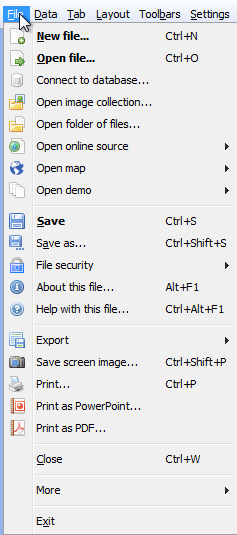
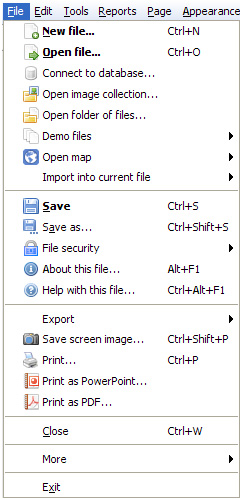
The File > ... menu groups commands related to importing data from a file, reporting views/table(s) of a relational database, online 'cloud' data sources, folder of images, a folder of files (documents, music, videos), maps from our online library or a preconfigured demo file. The second section provides options for saving Omniscope files with a wide range of options. The third section provides options for exporting new files in Omniscope and other formats, exporting screen images form Omniscope, and printing Omniscope files in varous document formats.
| New file [72] - opens a dialog where you can specify how many rows and columns you need to start with. Generally, you should start small, except if you are planning to cut-and-paste data into the new Omniscope file, in which case you must specify enough rows and columns to receive the paste. Open file [13]- launches the Open file dialog, which looks like a Windows file browse window, but has some additional features and options on the right side. Navigate your directory structure and find the file you wish to load, e.g. an existing Omniscope IOK file, or a supported delimited data file; Excel XLS, CSV (comma separated value) or other common data file formats such as TSV, TXT etc. Connect to database [14] - launches the Database Connection Wizard that helps you connect to any ODBC/JDBC [73] compliant relational database and import/refresh the output of any SQL statement that returns a tabular data set. Open image collection [15] - imports a collection of image files and associated editable tags from a defined folder/location Open folder of files [16]- imports filenames, attributes, paths and associated editable tags from selected folders containing documents, and/or media files like music or video, with options to display the selected docments (PDF) or to edit tags and file names on media file libraries and export a playlist. Open online source [17] - Open map [18] - Open demo [19] - |
Applies to version 2.4 only
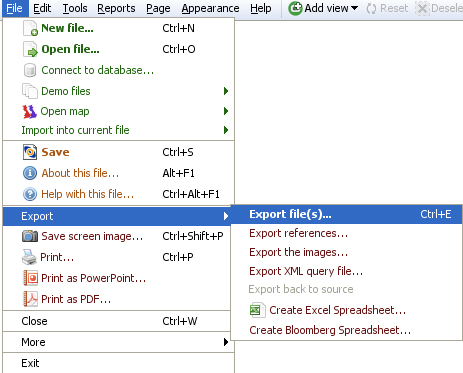
The File > Export > Export file(s) sub-menu provides many options for exporting some or all of the data, images and queries from the open Omniscope file for use by other applications, such as spreadsheets, or in the case of References and XML query files, by other Omniscope users with access to copies of the same IOK file.

Selecting File > Export > Export file(s) launches the Export Data wizard. Choosing File > Export > Export file(s) > Export References, > Export the images, and > Export XML query file also open the Export file wizard to the relevant tab.
The Export files wizard is a tabbed dialog that enables you to export data as a new Omniscope IOK file, an Excel XLS file, a list of references (values from one selected field/column) as a TXT file, a folder of images you have associated with (but not necessarily embedded into) the IOK file, or an Omniscope query as an XML file that can be opening by other Omniscopes to re-create the same view with the same data file. You change the type of file you want to export by selecting the appropriate tab at the top of the Export files wizard.
Selecting the Export Data tab will specify an Excel Workbook XLS file by default, but you can change the format of the exported data file to another supported format such as comma-separated value (CSV), tab-separated value (TSV) or an XML text data file (in Visokio schema [75]).
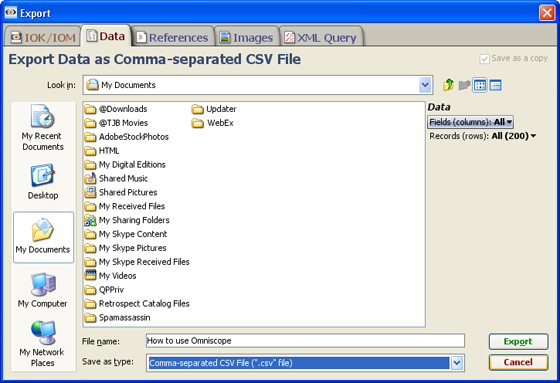
At the right side of the Export Data wizard, there are powerful options for specifying the fields (columns) and records (rows) to be exported. Untick any fields you do not want exported to the new file, and specify which data universe currently contains the records that you wish to export.
At any time, you can use the File > Save as or the Export Data wizard to create a new Omniscope IOK file from an existing one by selecting the first IOK tab on the Export Data wizard. In addition to specifying the fields and records you want to export, you also have several options to manage access and the refresh cycle for the new IOK file.
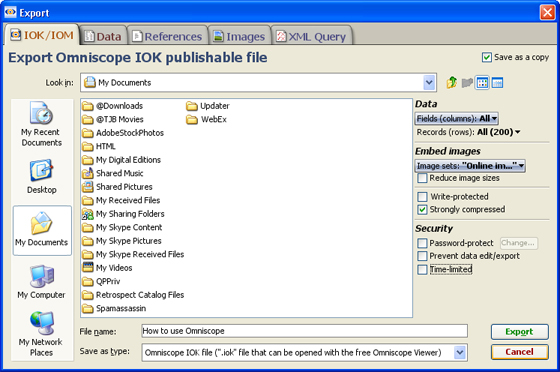
IOK files are already many times smaller than the equivalent spreadsheet file size. Strong compression reduces the size of IOK files even further, at the expense of requiring more memory and taking longer to save the file. Strong compression reduces CSV files much more than Zip compression, for example. You might use this if you are publishing or sending files via email or the web.
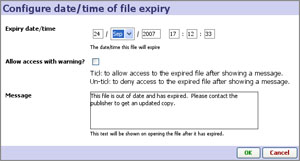
When creating new Omniscope IOK files, you can choose to save the new file using several options for managing access to the file, to the data inside the file, and the period of time for which the file will be valid. More on file security options. [76]
Sometimes you will want to export only a list of record (row) identifiers to share with others using Omniscope or other applications. Choosing the References tab in the Data Export dialog allows you to specify which field (column) you wish to export, and which Universe contains the records you wish to export.
{Version 2.3 and prior} For example, if you have saved a number of interesting records in the Basket, you would specify BASKET, rather than IN, SELECTION or ALL universes as the source of the records references to be exported.
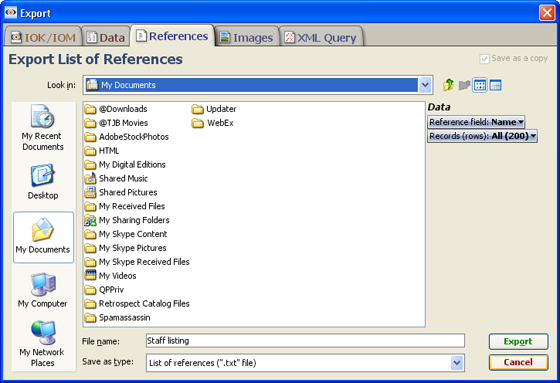
Reference files are exported as single column TXT files, useful for importing/matching in to other applications or other Omniscopes to re-create the same list, perhaps with updated data, for co-workers or customers.
If you have associated an image set with a particular Omniscope file, the Export Data dialog will display an Images tab option. Selecting this tab allows you to create a new copy of the image folder, perhaps changing the size of the images to reduce the size of the files in which they will be embedded. If you have downloaded all online images associated with a file (by opening a Tile View showing the images, or using record cycling in the Details view, for example) you can export a copy of those images to a folder for local use.
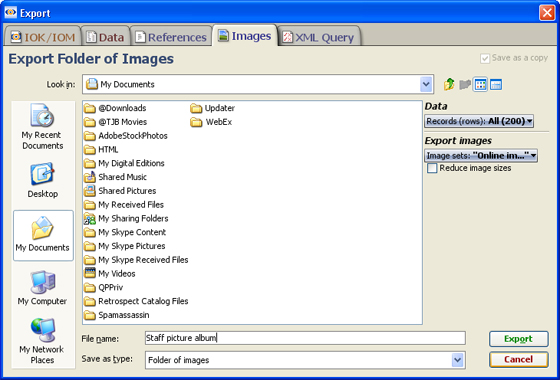
Note that the image set to be exported only needs to be associated with (but not necessarily embedded into) the current Omniscope file in order to use the Export Folder of Images option. If you are exporting an embedded image set that you have already reduced from the original sizes, Omniscope may warn you that it does not have access to the folder with the images at original size, and that the images in the new, exported folder will be of reduced size.
Any pattern of filter settings and history of Moves and Keeps can be saved as a named query, using an XML file only Omniscope can read and load as a query. The query may be the current active query, or any query associated with a Report Page defined in the file.
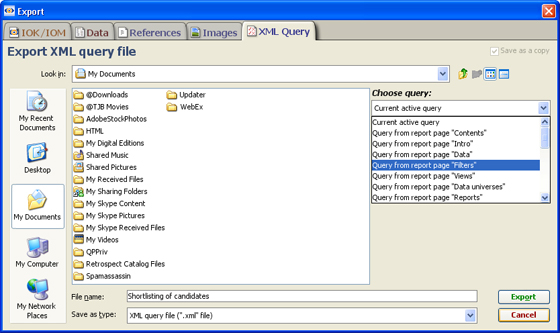
Exported queries can only be opened by other Omniscopes with open files that have the same fields present. There may be new records or changed data values in the version of the file importing the query, however. The export/import XML queries feature is used to permit others to quickly reproduce a data quality or screening views using the IN and OUT universes, perhaps on a daily basis as the data in each successive version of the Omniscope file changes.
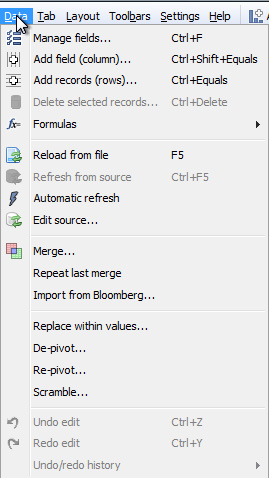
The Data > menu groups commands for managing the underlying tabular data set in the open file, including adding fields (columns) and records (rows), creating formula fields, refreshing the data from source(s), merging in data from other sources, changing the row & column oreintation of the data set, etc.
| Manage fields - |
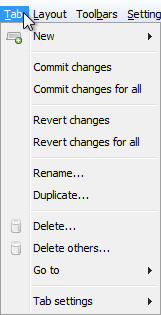
The Tab > ... menu groups commands providing options for creating new tabs, for managing the options to commit or revert changes you have made to the configuration of tabs, deleting tabs and managing tab settings.
| New - provides options for creating a new tab. There are many options and settings. |
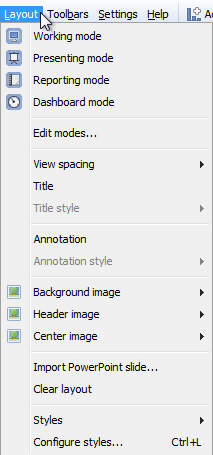
The Layout > ... menu groups commands governing the appearance of each tab, e.g. formatting, spacing, titles and annotations, images,etc. Make sure to go Tab > commit changes to make the defined layout persistent. All of these Layout modes can be customised using the Edit modes [77] wizard. You can also use pre-defined Styles, or configure custom Styles to match your organisation's presentation standards.
| Display mode options: quickly change the layout of each tab for different purposes. These layout mode icons are also available at the far right of the Main Toolbar [1]. |
Clear layout - removes all the display elements outside of the views displayed on the current tab
Styles - combinations of settings that can be applied to a specific file, and also shared with other users. You can use standard pre-configured Styles, or create a custom organisational Style to apply to all Omniscope file created by a given organisation. For more information, see Styles & Configure styles [25]and also the KnowledgeBase section on sharing custom styles [79].
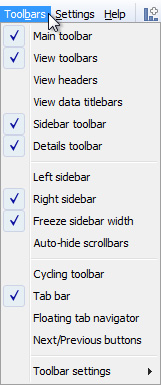
Toolbars > ... groups commands governing the tab-specific visibility of various toolbars and other on-screen tab navigation and filtering aids. Most of these settings are used in the Presentation phase of the configuration checklist [80].
| Main toolbar- untick to hide the Main Toolbar on a given tab. Done automatically in some Layout modes, e.g. Reporting Mode. If hidden, the Main Toolbar will still descend into view whenever the user hover Cycling toolbar - unticked by default, allows you to hide/show cycling toolbar Tab bar - ticked by default, allows you to hide/show the top tab bar. Hiding the top tab bar can be useful if there is only one tab in the file, or if you have decided to display the tab menus on the Sidebar. |
 | Floating tab navigator - unticked by default, when ticked this option displays a presentation tab navigator similar to that used in PowerPoint faintly at the bottom left hand corner of each tab. In addition to forward and back arrows for changing tabs sequentially, the central option pops-up a full listing of the tabs in the file, enabling the user to go directly to that tab in the presentation. | Next/Previous buttons - unticked by default, allows you to show Next and Previous arrow buttons at the bottom of each tab as another option for paging through presentations. |
Toolbar settings - Contains settings which control the behaviour of toolbars as the size of the Omniscope window and the display windows within are expanded or reduced.
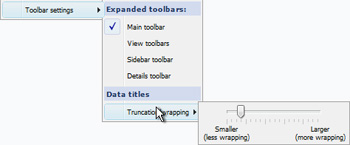 | Expanded Toolbars: Data Titles: |
{new in 2.6 - hold the Control (Ctrl) key down to apply these settings to all tabs, not just the current tab}
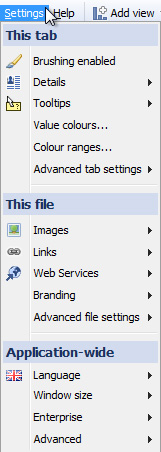
Settings > ... groups commands relating to setting options at Tab level, File level, and Application-wide level.
| This Tab: Details - Tooltips - Value colours - Colour ranges - Advanced tab settings -
This File: Images - Links - Web Services - Branding - Advanced file settings -
Application-wide: Language - Window size - Enterprise - {Enterprise editions only} Advanced - |
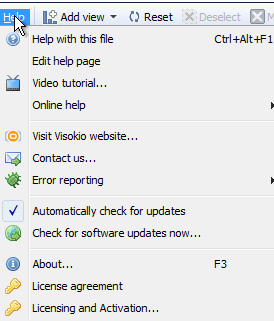
Help > ... groups commands and links to online resources that can help you make the most of your Omniscope installation.
| Help with this file - opens the file-specific |
The Online help sub-menu contains links to various learning resources:
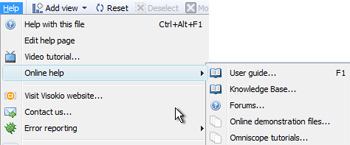 | Online Help sub-menu:
|
The Error reporting sub-menu contains options for sending reports to us automatically, helping to diagnose problems and retrieving error reports that we not able to be send automatically and need to be sent to us as e-mail attachments.
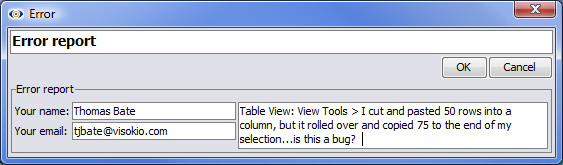
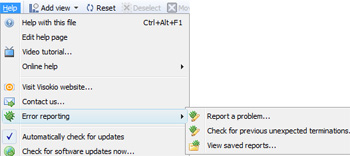 | Report a problem - if your installation is permitted to contact our server at services.visokio.com on port 80, you can automatically file a report that provides us a snapshot of the technical description of you machine and what was happening if an exception (software processing error) is reported while you are working. Please always send these reports, even with queries not resulting from exceptions, since the report provides most of the the technical information we need to respond to you. |
Example problem/error report: No personal information (other than the e-mail address needed to respond to you) and none of your actual data is ever communicated to us in these reports.
Check for previous unexpected terminations - this is a diagnostic option you will not normally need to use, but we may ask you to use it as part of a troubleshooting sequence.
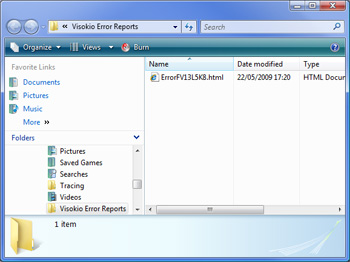 | View saved reports - if an exception occurs while you are offline, or in a location where access to our server at services.visokio.com port 80 has not yet been unblocked, the report will be saved as an HTML file in a location that depends on your operating system. This command will reveal the location of any saved reports. Please always attach these reports to an email addressed to support AT visokio DOT com |
This page lists Main Toolbar command menu items in Omniscope 2.4 which have been re-located in version 2.5. The old 2.4 command menu name/location is shown like this. The new 2.5 command/location is shown like this. Commands whose names/locations have not changed are not listed here.
For the full list of Main Toolbar commands, see the Commands Reference sections for version 2.5 [30]+ or 2.4 and previous [3].
|File [89]|Edit [90] [90]|Tools [91] [91]|Reports [92] [92]|Page [93] [93]|Appearance [94]|Help [95]| |
Omniscope 2.4 File menu
Omniscope 2.4 Edit menu Data menu
Omniscope 2.4 Tools menu Settings menu
Omniscope 2.4 Reports menu Tab menu
Omniscpe 2.4 Page menu Layout menu
Omniscope 2.4 Appearance menu
Omniscope 2.4 Help menu
|
Below is an index to Main Toolbar command menus for version 2.4 and earlier. For information on commands and options related to specific Views and View Toolbars, please consult the Guide to Views. [2] The location of many commands have changed in 2.5 to make finding them clearer and more logically structured. If you're used to Omniscope 2.4, and can't find a command in 2.5, see this guide [4]. See also the full Command Reference for 2.5 [30].
Applies to version 2.4 only; most of these commands are now on the File Menu (2.5) [5]
The File > menu on the Main Toolbar contains commands used to import data into Omniscope, manage .IOK files, and export data from Omniscope in various file formats and as images for printing/pasting into documents. Commands accessible from the File > drop down on the Omniscope Main Toolbar include:
 | New - Choosing New creates a new blank table with an initial number of fields (columns) and rows (records) you can specify. The default is 500 rows and 6 columns. If you have an activated Edition, you can set the number of rows and columns to be larger. Once you specify a size, a new blank table will open showing the 3 empty default views; Table View, Pie View and Chart View. In the Table View, right click on column header 'A' and select Tools > Rename field to begin assigning your own names to the fields, then begin entering data as you would for a spreadsheet. Note: You can also administer the naming and data typing of each column from the Edit > Manage Fields menu. Open File - Choosing Open file launches the Open Dataset wizard, which looks like a Windows file browse window, but has some additional features and options on the right side. Navigate your directory structure and find the file you wish to load, be it an existing Omniscope .IOK file, or a data in a supported data file format; Excel .XLS, .CSV (comma separated value) or other delimited text data file formats such as .TSV, .TXT etc. The Open Data Set wizard looks like a Windows file browse dialog:
|
The ![]() Help icon in the upper right of the Open Dataset Wizard [111] displays a format guide [112] for importing spreadsheet files. Always confirm that your spreadsheets conform to this simple layout before trying to open them in Omniscope. For more detail, see Using the Open Dataset wizard. If you encounter problems, see also the Knowledge Base section on importing and exporting data to and from Data Files. [113]
Help icon in the upper right of the Open Dataset Wizard [111] displays a format guide [112] for importing spreadsheet files. Always confirm that your spreadsheets conform to this simple layout before trying to open them in Omniscope. For more detail, see Using the Open Dataset wizard. If you encounter problems, see also the Knowledge Base section on importing and exporting data to and from Data Files. [113]
Connect to database - The Connect to database command launches the Database Connection wizard which guides you through the steps required to import data directly from a relational database table/view instead of an exported data file.
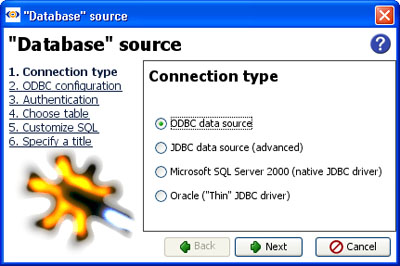
Omniscope uses ODBC or JDBC [114]protocols to access database files. For more detail, consult the Knowledge Base Database Connections [115] section.
Open image collection - Omniscope can be used to inspect and manage collections (folders) of images, for use as embedded image sets in Omniscope, as image folders associated with DataPlayers, or for any purpose where well-organised and documented (large) folders of images must be assembled, inspected, managed and shared with others at any size/resolution. More on using Open Images [116].
Open folder of files - Omniscope can also be used to visualise and navigate collections (folders) of computer files, whether the files are a .PDF document archive on a file server, a collection of podcasts or videos, or the entire contents of your hard disk drive. Omniscope permits you to visualise the relative size and age of the files, sort them based on data modified, etc. If you point Omniscope at a folder containing documents in .PDF format, the documents will display in the Omniscope Web View when selected. More on using Open Folder of files [117].
Demo files - Omniscope installs with a selection of embedded demo files you can use to familiarise yourself with the possibilities inherent in Omniscope. Some of the embedded demo files have associated image sets that can be downloaded when the application is launched. In some cases, you can download the image sets separately and associate and re-size the image set yourself. See Image Sets [118] under the Resources section of our web site.
Open Map - This option is used to add more maps to your installation or import and embed a specific image file for use as a Map View backdrop with a custom co-ordinate system. Freely-downloadable, embedded vector maps from the Visokio Maps Library can be accessed and downloaded at anytime. The Open Maps command displays all the maps which are already stored on your machine (the files are usually located in C:\Program Files\Visokio Common\maps) for use in both Omniscope and Flash DataPlayer .SWF files.
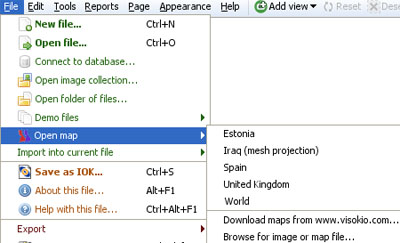
The Open Map command reveals available maps already downloaded, the default world map, the option to download additional standard Visokio maps, and the option to browse for and import/embed an image or customised map file for use as a backdrop with a derived coordinate grid. Recognised map file types for import and embedding include Image (.JPG, .PNG, .GIF, etc. depending on your version of Java), files, plus (Visokio) .MAP, .VEC, and .ILF files. Whether you download a standard map or import a customised map, the next display will be in the Map View [119]. For more information on using geographic coordinate systems with Visokio maps and customising co-ordinate systems for use with imported images such as floor plans or sports fields, consult the Knowledge Base section on Maps & Coordinates [120].
Import into current file - This command reveals a sub-menu containing options for refreshing data from linked sources, administering the data sources linked to a specific file, importing XML query files to recreate record selections sent by others, importing single column lists of references sent by others as .TXT files for matching, merging in (or repeating the merge of) additional columns or rows of data from other .IOK or .XLS/.CSV data files (see using the Merge Data wizard [99]), and importing/refreshing fields from Bloomberg (Professional & Enterprise Editions only, assuming you are running on a Bloomberg-connected PC).
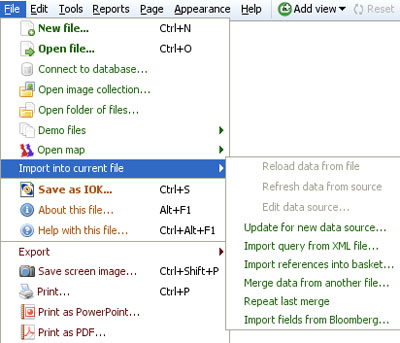
For more detail on the sub-menu commands, see the section on the Import into current file [98] sub-menu.
Save/Save As .IOK - This creates a new Omniscope file based on the existing one you have open. This command uses the same Data Export wizard screens discussed here [101], with the export data file type already set to .IOK, and the same data sub-set and field (column) selection options used when exporting subsets of your data to .XLS or .CSV files. When creating a new version of an .IOK file, you can also choose to save the new .IOK file with additional options:
The Save as copy option makes it possible to save the file to another location, without changing the location of the current directory, so you can save an later update to the same base location, for example.
File security - depending on your edition (Professional or Enterprise) allows you to set some of the security options available for the file. For more detail on security options for Omniscope files, see section on file security options [76].
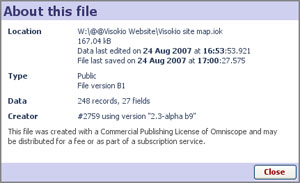
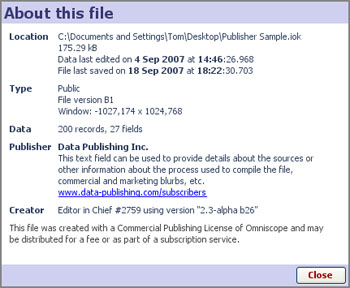
About this file - displays an informational screen giving administrative and licensing details about the open file. For details about your installation of Omniscope, press Ctrl+F1
Help with this file - displays the file-specific Help page you can configure for file recipients using the Help > Edit help page wizard. See Help Menu commands [69] for more information and an example.
Note: Publisher-authored Help pages are not currently Report Page-specific.
Export- this command reveals a sub-menu of options for exporting some or all of the data from the current .IOK/.IOM file.
Selecting Export launches the Export files dialog [101] with the export file type already set by default to Excel .XLS workbook files. You can change this to .CSV or other supported data file types.
Export references- launches the Export files dialog [101] with the export file type already set to the single column .TXT file format. The wizard allows you to specify the field and records (by universe) from which to generate an exported a list of references.
Export the images- launches the Export files dialog [101] with the export file type already set to a folder of images. The wizard allows you to choose which associated image set you wish to export and to set re-sizing limits on individual picture size to limit the maximum size of the images exported to the folder. Note: Omniscope files make excellent image catalogues. You can view and filter a collection of images, put selected images in the Basket, then export them as a new collection to a folder for re-use.
Export XML query- launches the Export files dialog [101] with the export file type already set to XML Query. This allows you to export your current filter settings (query) or any other named query as a small, portable text file that others (such as database administrators, customers, etc) who have the same Omniscope file can load the query file and instantly focus their display on the exact sub-set of records corresponding to your exported query.
Export back to source- will overwrite the linked data source file (but not a relational database table/view) with corrected/edited data from the Omniscope file.
Warning: if your source data file is a spreadsheet file with formulae, formatting or comments fields, they will be overwritten and lost.
Create Excel spreadsheet- creates a new Excel spreadsheet containing the fields (cxolumns) and data subset you specify. Note that if you want to paste data from Omniscope into an existing Excel spreadsheet, you can also use copy/paste. You must have Excel installed to use these features.
Create Bloomberg spreadsheet- creates a new Excel spreadsheet including imported, automatically refreshing Bloomberg fields i.e. source files that can update in real-time. Professional and Enterprise Editions only. You must have Bloomberg access and Excel installed on your PC to use this feature. For more information, see Working with Bloomberg [22].
Save screen image- Exports the current screen display in a range of image file formats (.JPG, .BMP, .GIF, .PNG, .WBMP) suitable for pasting into other applications. Also provides an option to copy the image directly to the clipboard for re-use.
Print screen- Sends the current screen display to your printer as an image.
Print page- for more detail on Printing, see Printing options [102]
Print as PowerPoint- for more detail on Printing, see Printing options [102]
Print as .PDF- for more detail on Printing, see Printing options [102]
Close- closes the current Omniscope file. Opening a new Omniscope file will automatically close the Omniscope file currently open. You will asked if you want to save your changes first.
Exit- Exits the Omniscope application (but not the Enterprise Edition Scheduler or Generator, which are autonomous applications intended to be run on always-on servers). You will be asked if you want to save if you have made changes to data or view configurations, but neither closing nor exiting will commit changes to Report Pages. The file will next open with the Report Page tabs in red, indicating that you have to either commit the changes or revert to the original configuration of the Report Page.
Applies to version 2.4 only; most of these commands are now on the Data M [6]enu (2.5) [6]
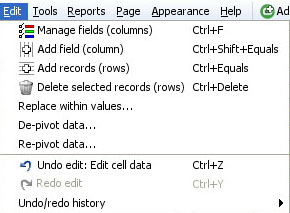 | Manage fields - launches the powerful and useful Manage Fields dialog, from which you can configure nearly every aspect of each field (column) in your data set such as adding, removing, hiding and globally re-ordering fields. Also used to manage/change the data typing for each column (integer number, decimal number, dates and times, text and categories) and to configure and format the way the values are displayed. For more information, see Using Manage Fields. [20] Add field (column) - adds a new, blank field (column) to the dataset. Unless you are in Reports Mode, you will see the new column appear at the far right in the Table View. If you are in Reports Mode, the new column will not be visible until you go to View Tools > Column Options > Columns to show, find the new field at the bottom of the pick list, tick it to reveal the new column and drag it into place in that Table View. This command is also available at the bottom of the Manage Fields dialog. The difference is that if you drag the new column into place using the Manage Fields dialog re-order, it will position the new column globally for all views, not just the Table View (and pop-up Show details table) or a Table View in a Report Page.
|
Add records (rows) - adds a specified number of new records (rows) to the bottom of the data set. This can also be done (with more precision as tgo where the rows are added) from the Table View row header right-click menu.
Delete selected records (rows) - deletes selected rows (can be un-done using Undo edit ...see below)
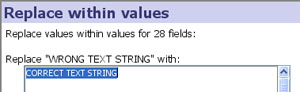
Replace within values - used to perform global search and replace operations. Choose which fields (columns) you are going to search and replace, then type in exactly the text string to be found, and the string you wish to replace it with.
De-pivot/Re-pivot data - Sometimes source data is laid out 'horizontally' when Omniscope would manage it better 'vertically' (e.g. time series), and vice-versa. Sometimes data needs to be exported from Omniscope in an orientation different from that used in Omniscope reports. To avoid the time consuming process of changing the orientation of data from horizontal to vertical (row becomes column) or vertical to horizontal (column becomes row), Omniscope has both a De-pivot and Re-pivot function. Use of these functions is discussed in more detail here [24].
Note: Omniscope does not currently support transposing a data set (exchanging all rows and columns) with or without headers.
Undo/Redo edit - allows you to reverse data editing operations
Undo/Redo history - keeps a history of reversible operations. Operations which can no longer be reversed/re-done are greyed out.
Applies to 2.4 only; most of these options are now on the Settings Menu 2.5 [10]
The Main Toolbar Tools menu and sub-menus group together commands and options for managing data refresh, language settings, 'brushing' or fading of unselected records, display of individual record-level details, links to related content and services outside the file, associating image sets with the file and many advanced configuration options.
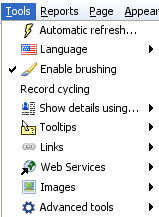 | Automatic refresh - when ticked, displays the Automatic refresh drop-down management menu and Hold button on the right side of the Main Toolbar. |
In addition to using the Details View, there are various options for showing record-level details.
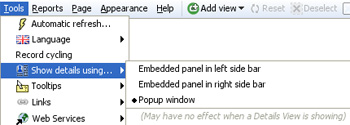
The default (whenever the Details View is not open) is to display details using the pop-up window. If Sidebars are visible, there are options to display details panels at the bottom of either one (but not both) of the Sidebars. For more information, see Viewing Details [123]
Tooltips are temporary text displays that appear whenever you hover your mouse over a marker or other representation of one (or a group of) record(s) in the data set. Using the drop-down pick list, you can select which field values will be displayed whenever Tooltip displays are visible.
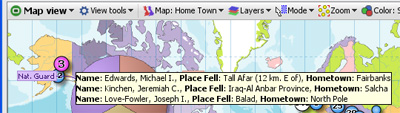
Tooltip displays are Report Page specific. If you are in Reports Mode, the selections you make will be remembered and the selected values will appear in all Tooltip displays on that Reports Page. If you Exit Reports, the Tooltip displays will revert to the defaults you set for the file. Note: Use Tooltips sparingly...selecting too many field values to display will can create large blocks of text values that obscure too much of the open views.
You can also choose to display associated image sets as Tooltips:
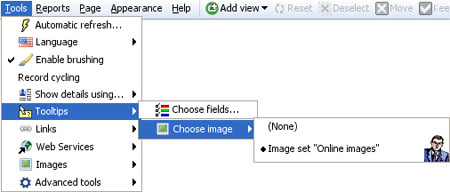
To learn how to associate image sets with your Omniscope files, see Tools > Images below.
Links extend your file users' experience to include content not contained within the Omniscope file itself. By adding links, anyone can integrate related external content (documents, files and web pages) into their Omniscope files, with one-click access via their local network, and the open web.
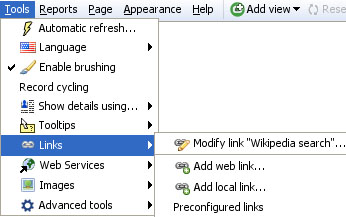
You specify links and make them available for use within your Omniscope file using the Add web link, Add local link and Preconfigured links dialogs. For more information, see Tools > Links [124].
Web Services are data processing services that use Internet standards to post data to a remote server, which usually delivers a response in web page format. Popular examples of Web Services in action include submitting text to a search engine and receiving the results page, or submitting stock tickers to view price charts. (definition of Web Services [125]).
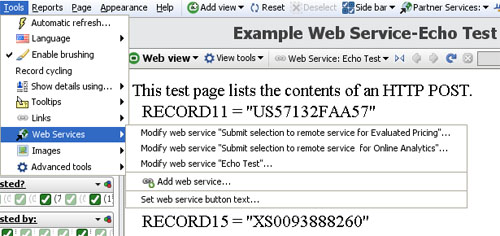
Omniscope is a 'hybrid' web/desktop application that is easy to integrate with Web Services. In addition to the preconfigured free web services (that accept a single value text string input) available on the Links menu, there is also a useful multi-record submit Web Service via HTTP POST available in Omniscope. The Tools > Web Services dialogs permit you to configure and edit Web Services that expect multi-record input to work seamlessly with your Omniscope files. Accepting the defaults under Add web service will configure an 'echo test' service (hosted by Visokio) in which our server repeats back a list of references you have selected in your local Omniscope file. More information on configuring and using web services with Omniscope is available in Tools > Web Services [126]and the Web View [44] subsection on using Web Services [127].
Before you can display images, you must associate one or more folders of images with the .IOK file as a named image set. Preparation for this involves saving a set of images in a single folder with a consistent naming convention, such that the same text values are present in one of the columns of your .IOK file (it may be a column included just to hold the names of the images). It is also possible for Omniscope to display multiple images per record, provided you have entered multiple 'tokenized' values in the image reference cell.
There are 3 ways to display image sets in Omniscope:
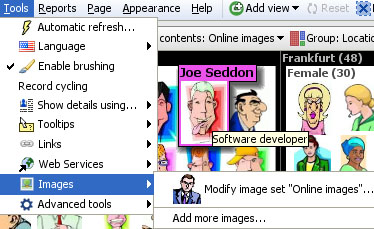
Once you have associated one or more image sets (each with single or multiple images per record) with your file, you can display these images in various views:
For more detail, see Adding Image Sets [128]
Omniscope can be used with any language. You can use existing translations, modify existing translations, or create your own translations files based on those that already exist.
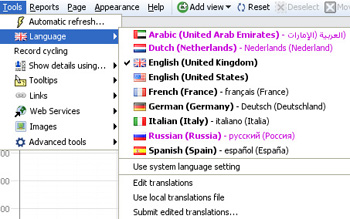
Language selector - choose from the list of available translations
Use system language setting - tick this option to start Omniscope with the language setting specified in the operating system. If a user selects a different language, it will override and untick this setting. That user's installation will open using the preferred language until reset using this command.
Edit translations - opens your local copy of the embedded EditedLanguages.iok translation file. You can make changes to the translations text in this file, being careful to follow the Guidelines in the Translations Guide [129]. When you have finished editing, choose File > Save (not Save As) to save the edited file in its original location. In Tools > Languages, ensure your edited language is selected, then close and re-start Omniscope to see the changes you made via the edited file.
Use local translations file - if you open the embedded EditedLanguages.iok file to make and save changes, this option will be ticked. To revert to showing the default translated text, untick this option and restart Omniscope.
Submit edited translations - if you would like your translations/edits to be included in the default for a given language, or added to the menu as a new language or variant, submit your EditedLanguages.iok file to us using this command.
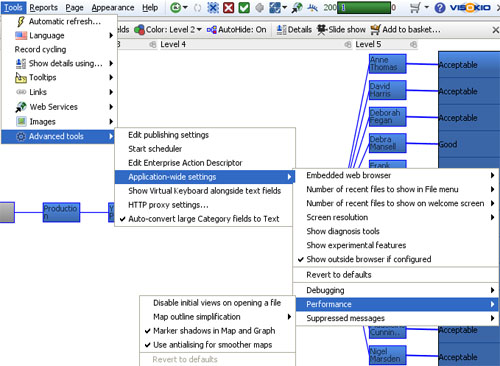
Additional Tools sub-menus are available from the Advanced Tools menus. Note: Some of these commands are only available in the Enterprise Edition.
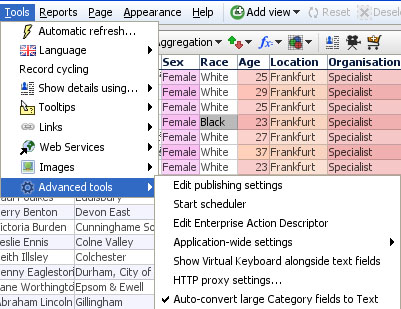
For more detail on these and other Tools > Advanced tools sub-menu commands, see Advanced Tools [130]
The Main Toolbar Tools > Advanced Tools menu and sub-menus include a number of important options, some of which (Edit publishing settings, Start Scheduler, and Edit Enterprise Action Descriptor) are only available in the Enterprise Edition and are discussed in the Enterprise Edition - Advanced Tools section below.
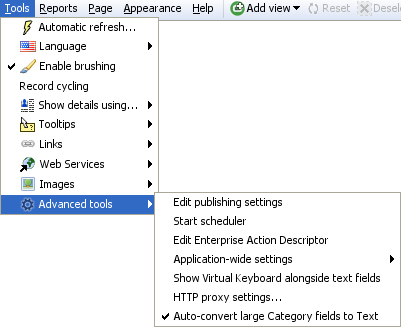 | Show virtual keyboard alongside text fields - tick to enable users to enter text without keyboards HTTP Proxy Settings - useful for activation, updates and automatic bug reporting. For more information, see Proxy Settings [131] in our KnowledgeBase. Autoconvert large Category fields to Text - by default, Omniscope will not treat a Text field (column) containing more than about 200 unique values as a Category field, for performance and other reasons. Sometimes there is some leeway around this depending on the size and composition of your data set, and some views will only display breakdowns by Categories. Unticking this option will allow you to experiment with treating some text fields as very large Categories. |
Warning: There is still a safe upper limit for unique values treated as Categories rather thanText. Trying to convert a field (column) with more than 500 unique values will definitely trigger a warning:
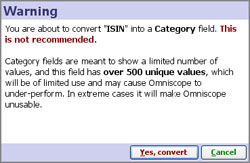
For more information on data typing and converting text fields to categories, see Edit > Manage Fields [20].
The application-wide settings sub-menu is used to configure various aspects of your Omniscope installation that apply to all files you open.
Embedded web browser - allows you to change the installed browser underlying the Web View and Outside browser (see below). Current options include Internet Explorer and Firefox/Mozilla.
Number of recent files to show in file menu - allows you to specify the number of recently-opened files to show at the bottom of the File menu.
Number of recent files to show on welcome screen - allows you to specify the number of recently-opened files to show under Recent files heading on the Welcome screen {version 2.3+}.
Screen resolution - Used to tell Omniscope the type of display screen the file will be used on (Handheld, Projector, Desktop or Kiosk/TV), so that layout, font size etc. can be optimised. This is the same as the display setting on upper right of the the Welcome screen {version 2.3+}. This is not the same as the option to change only the resolution displayed, which does not affect Omniscope's choice of layout, font size, etc. See also the command Appearance > Resize window to [56]: which changes only the resolution displayed.
Show diagnosis tools - this option reveals some additional error reporting options, for example a menu item to report errors on loading images from image sets. We may ask you to enable this to help with troubleshooting.
Show experimental features - every version of Omniscope contains some experimental features which are still under development.Tick this option if you want to reveal (in violet font) and test these features.
Show outside browser if configured... the Outside browser is an Omniscope web browser view which can opens alongside the Welcome Screen before any specific Omniscope file is opened. It is different from Web Views, which are configured within each file to open pointing at pre-defined links/web services as required. The Outside browser feature is used to provide a group of users the ability to browse and select from a library of Omniscope and other data files displayed on a (usually permissioned) web page. For more information, see Using the Outside Browser [132].
Revert to defaults - resets all Application-wide settings menu options to the default settings.
Debugging - used to create log files that record each event in various processes. We may ask you to tick some or all of these in order to generate a log file we can review to help us troubleshoot problems.
Disable initial views on opening a file - this setting enables you to explicitly control, one-by-one, the views that open with your data. It is used to recover files whose initial opening configuration becomes unusable for some reason, or where opening very large files on machines with limited RAM that require the utmost conservation of memory. Warning: If you leave this setting ticked, all files will open with no views showing....use only when dealing with specific circumstances.
Map outline simplification - reveals a sub-menu which allows you to adjust the resource demands associated with drawing and zooming/up-dating maps.
Marker shadows in Map and Graph Views - unticking this will improve performance in some files with very large numbers of markers visible in the Map or Graph Views.
Use anti-aliasing for smoother maps - unticking this will improve performance in some files with extensive use of maps
Reset to defaults - resets performance options to the default settings
The Enterprise Edition contains advanced automation, and file security revenue protection features useful in commercial data publishing:
Edit publishing settings - {Enterprise Edition only} this dialog is used to set the publisher identification text and links that will appear whenever a file recipient clicks on File > About on a file produced with this installation.
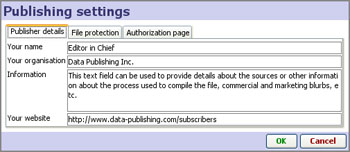 |  |
Edit publishing settings: file protection options - {Enterprise Edition only}
Protected- used to prevent data editing, export and copying (including copy-and-paste copying). Other options to time-limit or password-protect files are available from the File > Export or Save as [133] dialog.
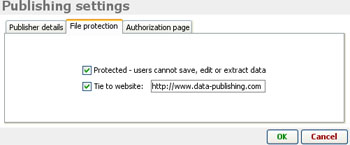
Tie to website - {Enterprise Edition only} enables domain locking, a powerful and effective revenue protection feature. Omniscope .IOK files are free-standing and easily transferred by e-mail, posting/downloading from blogs and websites, etc. Commercial publishers can use this domain-locking feature to require that anyone trying to open their files must be logged in to a specific web site. If the file recipient is not logged in, the .IOK file containing the data will not open, and will display a notice to that effect:
Start Scheduler - {Enterprise only} the Scheduler is Visokio application separate from Omniscope used to automate the refresh, import, merge and publishing/distribution of data files by defining a set of actions performed repeatedly on a specified time cycle. For more information, see Using the Scheduler [134].
Edit Enterprise Action Descriptor - {Enterprise only} the Scheduler uses Enterprise Actions Descriptors XML files, which you can configure using an Enterprise Edition user interface, or manually, based on a exported example specification. [135] Examples of actions which can be automated include:
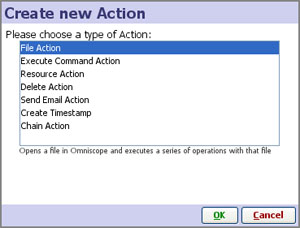
For more detail, see Creating and Editing XML Actions [136]
Applies to verson 2.4 only; most of these commands are now accessed from the Tab Menu 2.5 [7] or the "+" icon to the right of the final tab.
The Main Toolbar Reports menu provides access to all the commands used to create and administer Report Pages configured in the file. If no Report Pages are yet configured, you will see only the Create Page heading on the menu. If Omniscope is currently displaying a combination of views, queries, variable settings, etc. that you would like to make persistent, you should choose to create a Reports Page. Professional and Enterprise Editions can create any number of persistent, tabbed Report Pages, with sectioning and other advanced tab options.
| Create page from current Omniscope configuration. You will enter Reports Mode and all your current settings will be copied to create a new Reports Page. In Reports Mode, any further changes you make will apply only to the open Report Page, and all subsequent changes must be Committed to become persistent (see below). |
The commands below are also accessible from the Reports Navigator, which appears in the lower right-hand part of the screen when the file is in Reports Mode. These commands are more fully documented below in the Reports Navigator section.
Administer all pages - if you already have Reports Pages configured in your file, you can manage modifications to all pages, or delete them all using these commands.
Navigation: Start ; ...Go to Page - if you already have Reports Pages configured in the file, these commands allow you the access any Page, from the start or from a drop-down menu that appears on the right of the Go to Page command.
Show report tabs - this option displays a tab for each Report Page across the top of the Main Toolbar, even if you are also displaying buttons in the Side Bar Reports Panel.
To create a Report Page from the current display in Omniscope, or as a text or image slide/imported PowerPoint slide, use Reports > Create Page from the Main Toolbar Reports menu. If you have revealed the Sidebar Reports Panel, you can also click New to access the Create New Page wizard:
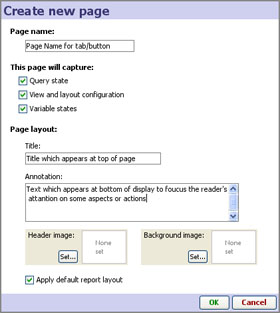 | Page name: this name appears on a report tab at the top of the display, or a button on the Side Bar Reports panel if you provide access to Report Pages there. You can change this name at any time on the tab or in the Reports panel. It is best to keep the page name relatively short, as you can use Title and Annotation fields below to convey more detail. |
Annotation: explanatory text to focus the readers' attention on specific aspects or actions. You can edit this at any time by double-clicking on the annotation text field.
Header/Background Image - adds images to each Report Page; Header images display at the top of the page, Background images can be faded and display in views that otherwise display blank backgrounds. For more information on fading background images, see Page menu commands. [55]
Apply default report layout: If you leave this box ticked, Omniscope will hide the View Toolbars and increase the margins around the views for a cleaner display. If you wish to preserve the existing settings, untick this box.
Once configured and named, each pre-defined, persistent Report Page appears anytime the user clicks on the top report tab, or the button next to the Report Page name in the Side Bar Reports panel, or uses the Report Navigator menu, which appears faintly in the bottom left corner of the display in Reports Mode.
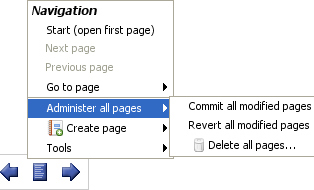 | Start; Next; Previous; Go to page...used to cycle through the Reports Pages already configured in the file. |
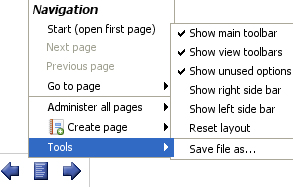 | Show/Hide main toolbar- when unticked, the Main Toolbar is not visible unless the user hovers the mouse near the top of the display. |
Reset layout - returns the page layout to the defaults, such as the Main Toolbar displayed, Report Tabs displayed, etc.
Save file as... saves the open file with a new name and/or settings and options, using the Export file as .IOK/.IOM [133]dialog
From the optional Sidebar Reports panel, you can group your Reports into sections, as shown in this example file [137]. To create a section name, choose Create New > Section at the bottom of the Sidebar Reports panel. Rename or delete sections using the black triangle drop down. Drag and drop to reorder reports in sections.
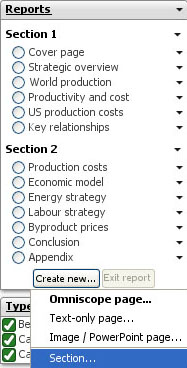
You can also mix query-only and view-only reports. To create such query-only or view-only report items, choose Create new Omniscope page from the New... button in the Reports panel, and select either Query state or Views and layout configuration.
This example file [137] illustrates navigating a set of query-only reports, grouped under a section name in the Side Bar Reports panel, and a set of view-only reports configurations, also grouped independently. This allows you to configure a set of different view configurations (by task, or form of analysis, such as 3 Web Views, or a Graph and a Web View, or 2 Pie Views) and an independent set of queries (such as last week's, or last month's trades, or erroneous trades) enabling users to navigate any combination independently. For example, a user might open Query A then Views X. They can then choose to either change to a Query B while keeping Views X displayed, or Views Y while keeping Query A displayed.
Note: the buttons in the Sidebar Reports Panel only highlight the last report item opened. If you open Query A then Views X, you will see only Views X selected in the Reports Panel. The view configuration from Views X will be showing and the filters will continue to represent Query A correctly. But because only Views X is actually selected, manipulating the query will not affect Query A.
Applies to version 2.4 only; most of these options are now on the Layout Menu 2.5 [8]
The Main Toolbar Page menu commands provide many options useful for creating more informative displays and Reports Pages. The commands on this menu can be used to configure many aspects of the current display. If you make changes to the current view using Page menu commands, then close and save the file, it will next open with those changes preserved in the current display, even if the display is not configured as a Report Page.
Page menu commands can be used to:
| Reset layout - removes any changes which have been made to the margins and other layout settings. If no changes have been made, the command is greyed out.
|
You can also tick/untick the options to Show/Hide the Main Toolbar and the View Toolbars for all views on the page. View Toolbars can usually be hidden if the users of the page are not expected to need access to the options available on them. Even when hidden, the Main Toolbar comes back into view whenever the user hovers the mouse near the top of the display.
Page menu commands apply to each Report Page individually, and any changes must be Committed to become a persistent change, or Reverted to return the Report Page to its default configuration/layout. For options covering aspects of the look and feel of Report Pages that apply to more then one page, see the Appearance [138] command menu.
Title and annotation text can be styled by choosing the font, the font size and face, as well as the horizontal alignment and text colour:
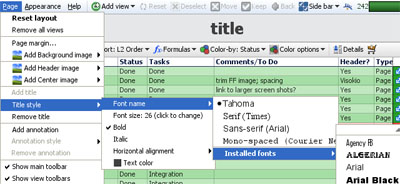
Background images can be faded so that they interfere less with other aspects of the display. Use the Fading slider to adjust the intensity of the image, from weak (very faded) to strong (barely faded).
Background image options also include 3 Crop style options for fitting background images of any size/aspect ratio to the display:
Header images are not intended to be faded and/or resized, as they are generally logos whose aspect ratios and legibility must be preserved. If you use a tall header image, it will increase the size of the margin at the top and reduce the display space usable for views.
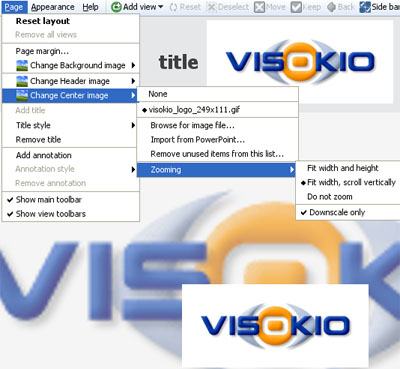
Centre images can be made from PowerPoint slides or other large screenshots. They are not intended to be faded, but do have zooming options and a control to stop the picture clarity from being reduced by up-scaling.
Applies to version 2.4 only; most of these options are available on the Settings menu 2.5 [10]
Omniscope files can be used not only to assemble, check, analyse and transform data, but also to distribute as interactive final reports and presentations for various audiences; senior management, customers, partners, friends...anyone with an Omniscope free Viewer or better. The Appearance menu commands enable you to change almost everything about the Omniscope display to conform with your desired look and feel and provide the simplest file opening experience for recipients of your files.
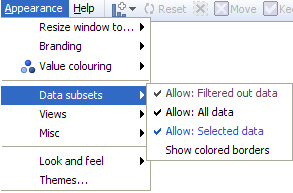
Allows you to resize the Omniscope display to preview how your Omniscope reports and presentations will look at various screen sizes ranging from SXGA (1280x1024 pixels) down to QVGA (320x240 pixels).
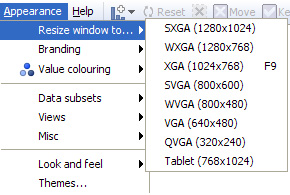
The Resize window to option only changes the size of the display. You can also adapt the default spacing of layouts, margins, font type and size, etc. to various screen types (Handheld, Projector/Laptop, Desktop and Kiosk/TV) using the Resolution option on the Welcome screen, or from the Main Toolbar Tools > Advanced Tools > Application-wide settings > Screen resolution.
Omniscope is a data file publishing system that supports a wide range of branding and corporate identity options. This includes advertising placement options for data publishing business models supported by advertising revenue.
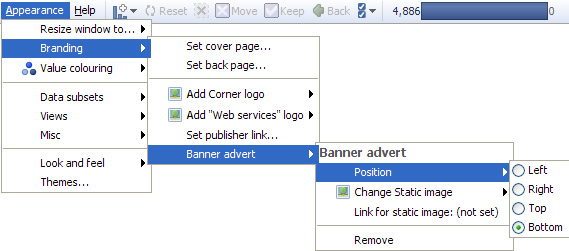
Set cover page; back page - these pages are informational displays (not interactive Reports Pages)
Clicking on the option to configure a Cover or Back informational page launches a Set ... Page dialog that accepts 5 inputs from you. The dialog to create the Back informational page is very similar to the Cover page example shown below:
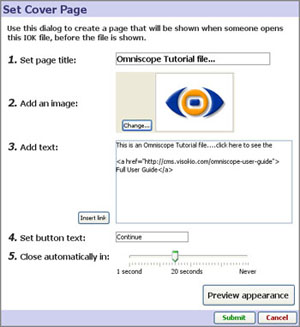 | 1. Set page title: enter text to display at the top of the page 2. Add an image: select an image to display (.JPG,.GIF,.BMP,.PNG depending on Java version) 3. Add text: add the text you wish to display, with hard returns to wrap the text evenly and keep the box size from becoming too wide. Basic HTML tags can be used to style the text Insert link: generates the full HTML to make a link you enter live. 4. Set button text: changes the text displayed in the button from 'Continue' to whatever you prefer 5. Close automatically in: sets the time delay to display the page (not used for the Help Page) |
When you are happy with your information page, click Submit to save the configuration and make the page active.
Add corner logo - allows you to replace the small Visokio logo in the upper right hand corner with a logo of your own. For best results, use a logo image about 19 pixels high. If you change the logo, the link associated with it will be changed to the URL you have entered under Set publisher link (see below).
Add Web Services logo - allows you add a logo to the Web Services menu tab on the Main Toolbar. For more information, see Configuring Web Services [108]
Set publisher link - allows you to enter the address of a web page (URL) that will be displayed as an active link in the File > About this file notice for all files produced with your installation. If you have substituted your own logo for the Visokio corner logo, clicking on your corner logo will also take the user to this URL.
Banner adverts - Omniscope supports the display of banner adverts with live links to the advertiser on each page. The adverts can be positioned at the top, right, left or bottom of the display, and do not affect placement of header images, titles, etc. In general, rectangular images look best, such as typical full-width banner ads. Note: Server-based deployment, Flash .SWF display, embedding animated .GIF images and Report Page specific adverts are not currently supported, but this may change in future versions. For more information and examples, see Advertising Options [139].
Omniscope makes extensive use of colouring by values to help you and the users of your files visualise the relationships, relative magnitudes and overall meaning in your data sets. The Appearance > Value colouring sub-menu contains options to change the way ranges of values within fields (columns) are coloured. It also has options to assign colours to specific values in fields automatically and control the colour palette Omniscope uses to assign initial colours to Category values. You can override colour assignments for specific values and range endpoints at any time using the colour selectors available in Edit > Manage Fields > Configure >Field Options > Change value order, colours and shapes.
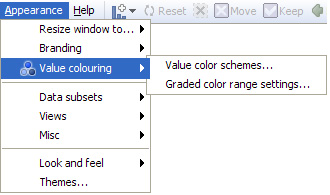
Value colour schemes - clicking launches a dialog that enables you to manage various aspects of colouring values:
Presets: a number of pre-configured combinations of settings are available, including 'Corporate Blue', 'Subdued' and 'Monochrome' colouring schemes. If you make changes to the defaults to create your own scheme, you can name it and save it for future use with specific files. To return to the default 'Classic' Presets, click on Revert to defaults.
Category fields:
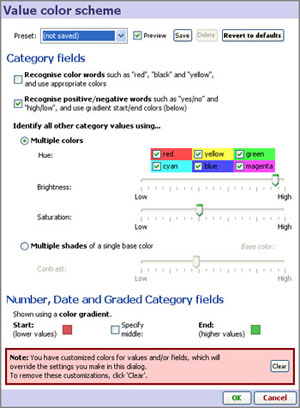 | Recognise colour & positive/negative words- when ticked, these options automatically assign pre-defined colours to recognised text values, such as 'red' or 'green' or 'yes' or 'no'. |
Number, Date and Graded Category fields - fields (columns) consisting of defined ranges of values, such as Number, Date & Time and Graded Category fields, are coloured according to a spectrum calculated based on the range between the lowest and highest values and the start (lowest) and end (highest) colour specified here. The default or 'Classic' scheme uses a range from red (lower values) to green (higher values). You can change the default here by clicking on the Start or End colours, and optionally specify a middle value to extend the colouring more or less depending on the middle colour chosen. At any time, you can change the colouring scheme applied to a specific field (column) using Edit > Manage Fields > Configure > Field options > Change value order, colours and shapes.
Note: If you do override the settings made in this dialog for one or more fields (columns), you can clear all of your customised settings using the Clear button shown above.
Graded colour ranges - this dialog determines default behaviour in colouring ranges for Number and Date & Time fields (columns).
Middle colour position: - by default, Omniscope assigns the middle colour of a range to the middle value in the field. This works well for relatively uniform distributions of values. However, if some very high or low values are present in the field, the result can 'compress' the colouring scheme such that there is not enough difference in colouring for most of the records.
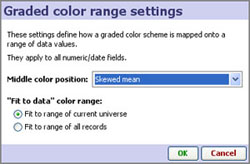
If many of your columns contain such 'skewed' distributions of values, you may want to set the default behaviour to assign the middle colour to the mean (average value), or for even more skewed distributions, to the skewed mean. If only a few fields (columns) are skewed, you may want to set the treatment of the skewed fields individually using Edit > Manage Fields > Field options > Change value colouring.
Fit to data colour range - Omniscope manages colour ranges in two modes; a filtering-neutral mode, which assigns and displays colours based on the full range of values in the field (column), and a dynamic filtering re-colouring mode, which re-calculates the range and re-assigns colours based on the range of values present in the universe being displayed. The default is the dynamic re-colouring mode, Fit range to current universe, but you can change the default setting here by selecting Fit to range of all records instead.
Omniscope selection, filtering and basket management functions assign every record in the data set to multiple data universes. By default, every view can be opened on any of the 5 universes, and each view indicates the target universe being displayed by the colour of the corner 'eye-con' and the view selection menu.
Allow OUT; ALL; SELECTION; BASKET - depending on the file and target users, you may want to simplify the menus and options by preventing views being opened on certain universes, such as the OUT or ALL universes. If these universes are not being used in Report Pages and could confuse novice users, you can prevent viewing them by removing them from the View Chooser. You can turn off access to all universes other than the IN universe by unticking them here.
Note: Users can re-enable access to universes on this menu, but not save changed versions of the file, provided you ticked the Prevent data edit/export option when you last saved the Omniscope file
Show coloured borders- this option provides for more visual impact by displaying a coloured border around each view indicating the target universe for the view.
Depending on the file and target users, you may want to simplify the display options by removing the Add View option from the Main Toolbar, or by removing certain views from the View Chooser. This could be because the view(s) are not useful, or because the size/configuration of the file makes some views slow relative to the usefulness of the view.
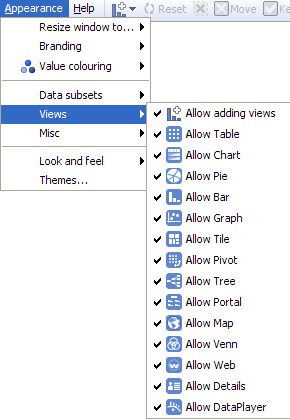
Note: Motivated users of the file can still access this menu and re-enable the view(s), so these are just menu simplification options rather than a short-cut to avoid configuring all views as meaningfully for your data as possible. However, provided you ticked the Prevent data edit/export option when you last saved the .IOK/.IOM file, any user that re-enables or otherwise changes the file settings in the Appearance menu will not be able to save or forward a persistent version of their changed .IOK/.IOM file.
Omniscope is designed to be used for analysis, but also for distribution as final reports, for giving live presentations and for printing as static PowerPoint slides or Adobe Acrobat .PDF documents. Depending on the immediate use you have for the file, you may wish to modify certain aspects of the display:
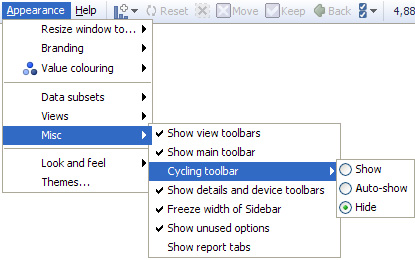
Show/hide view toolbars - untick this option to hide the View Toolbars, making the display appear more like a final report/presentation
Show/hide main toolbar - untick to hide the Main Toolbar across the top (it will always re-appear when the mouse hovers near the top of the display)
Freeze width of Side Bar(s) - untick this option to allow users to narrow or widen the Side Bars (Report Page-specific)
Show unused options - untick to simplify menus by removing references to options not used in the file.
Show report tabs - untick to hide report tabs at the top, under the Main Toolbar.
In addition to defining colouring schemes for value ranges, you can also manage the overall aesthetics of your file using the options available on the Appearance > Look and Feel sub-menu. The options available on this sub-menu are used to define Themes, combinations of settings you can use to, for example, mute the colouring application-wide to achieve a more corporate look. The best way to see the differences these settings can make is to try applying the pre-configured Themes (see below), then opening the Look and Feel dialog and noting the settings used. Note: Look and Feel menu options are Report Page-specific. To apply the same settings to all the Report Pages in your file, choose Apply these settings to all pages.
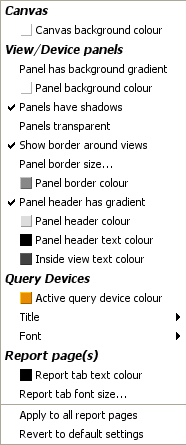 | Canvas: Canvas background colour - sets the colour of the background displayed when no view is open, in the margins, and behind the title and annotation text. Query Devices settings: (see below) Report Page(s) settings: (see below) |
Query Devices settings: (displayed on the Sidebars)
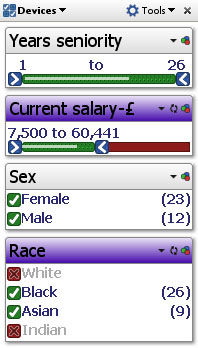 | Active query device colour - changes the colour indicating that a filter/query device is active from the default dark orange to any other colour (purple in the example left) |
Report Page(s) settings: Tabs
Report tab text colour - sets the colour of Report Page tab text
Report tab font size - sets the size of the Report Page tab text
![]()
Themes are combinations of settings of options for Look & Feel. A list of pre-defined Themes come with the application. You can modify these Themes, or create your own, and save your modified settings as a new Theme with a name you assign. Your Theme(s) will be saved in your program folder and will be available for use in all files you prepare with your installation. There is the option to apply the Theme to all Report Pages.
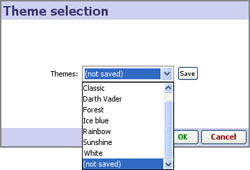
Note: From version 2.5 onwards, Themes are referred to as Styles
Applies to version 2.4 only; most of these commands are now on the Help menu 2.5 [11]
The Main Toolbar Help menu contains links to a wide range of learning and support options:
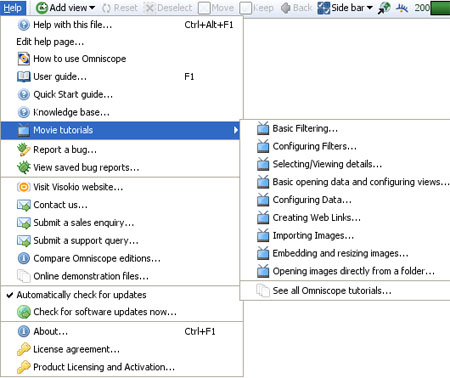
Help with this file- launches the file-specific Help page display you can create to explain the finer points of your file to users. You create this Help page for each file using the Help > Edit help page command below.
Note: Help with this file screens are not Report Page specific...use Annotations and Field Notes instead.
Edit help page - opens the Set Help Page dialog to compose your help page
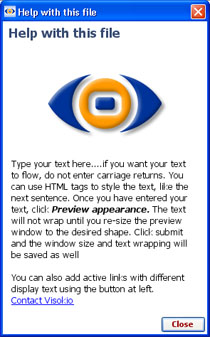 | 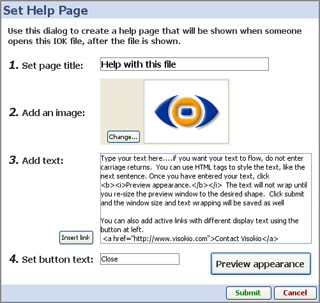 |
How to use Omniscope - launches the embedded, interactive, tabbed tutorial file illustrating the major features of Omniscope.
User Guide - links to this Omniscope User Guide [84]
Quick Start guide - links to the one-page introduction [140] contained in this User Guide
Movie tutorials - links to various Flash screencasts illustrating common tasks in Omniscope.
Report a bug - if Omniscope displays an error message (throws an exception), or if you see something you think is a bug, please use this form to tell us about it.
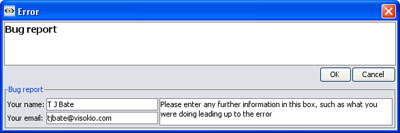
Try to give us as many details as you can regarding what you were doing at the time. This will help us try to reproduce the problem. If the file does not respond, send us the file if you can. If your machine hangs, there is a Hang Diagnosis procedure [141].
View saved bug reports - If you are offline when filing bug reports, Omniscope will save them for review and forwarding to us via e-mail.
Visit Visokio website - this links to our main site homepage at www.visokio.com [82]
Contact us - links to our contact page [142]
Submit a sales enquiry - links to our contact page [142] for license sales
Submit a support query - links to our contact page [142]for support
Compare Omniscope Editions - links to our comparison chart [143] summarising differentiating features of the various editions of Omniscope.
Online Demonstration files - links to our main demos page [144], which features more and larger demos than those embedded in the application. Embedded demos are accessible from the Main Toolbar under Files > Demo files and from the opening screen Demos section.
Automatically check for updates - tick this option if you want Omniscope to check for a newer version every time you start the application
Check for updates now - confirms that you have the latest version installed
About - very useful display of your edition/version number, whether or not you are licensed for Commercial Publishing, your license key number (keep a copy in a safe place) and the version of Java that Omniscope is using (there may be more than one version of Java on your machine).
License agreement - links to our licensing page [145]with full text copies of our licensing agreements.
Product licensing and activation - this menu is used to convert a free Viewer to an activated Edition, and to deactivate an activated installation prior to re-building the machine or moving the key to another machine (you may do this a maximum of 3 times). It is also advisable to periodically Refresh your activation after installing a newer version over an older one. For more detail see the Activation and Refresh [146].
Omniscope can connect to and import data from any relational database that supports common protocols like ODBC and JDBC. The Database Connection wizard guides you through the process of connecting and importing your data, and saving it as a new Omniscope file. Your file will remember its source(s), and on refresh re-execute the embedded SQL statement to re-generate the reporting view/table and repeat any subsequent merges with other files either on opening, or on demand.
The Omniscope Database Connection wizard lets you define a connection and pass any standard SQL expression that results in a single 'flat' table. If you do not have authorisation to execute SQL statements, or don't know the SQL required to generate the table you want, your Database Administrator may have to create the connection in the wizard and/or create the appropriate reporting view(s).
Some organisations also have additional high-performance analytical and reporting databases that pre-prepare data for reports by performing joins, aggregations, sorts and scans on data assembled from multiple transactional databases. In general, Omniscope interacts with 'business intelligence' analytical databases in exactly the same way as transactional database views/tables. For more technical information, see the Database Connections [147] section of the KnowledgeBase.
Clicking on File > Connect to database launches the Database Connection wizard. The wizard guides you through a six-step process for defining a linked data source from a relational database view/table. You will need to know the type of database and its connection details. Using the Database Connection wizard, you enter the connection details for your database and choose which database table or reporting view you wish to retrieve data from. By default, this will create a persistent linked data source relationship between this database table/view and the Omniscope file.
 | 1. Connection type: Select the type of connection you are creating from the options currently available.
ODBC - use this option to connect to defined data sources, like MS Access. Can also be used to connect to spreadsheets for testing.
JDBC - use with databases other than MS SQL Server & Oracle if you have the JDBC driver installed.
MS SQL Server - use this option with MS SQL Server 2000. If you have 2005 or 2008 use the generic JDBC option.
Oracle - use this option with all versions of Oracle databases
Detailed examples of each type of connection are available in our KnowledgeBase. [148] |
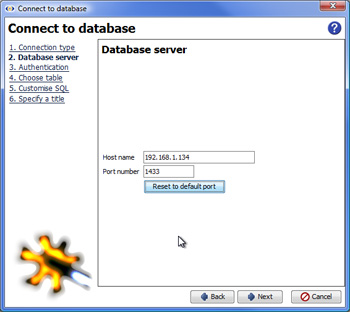 | 2. Database Server (ODBC configuration): Assuming you chose the most common ODBC connection type , you will be asked for a name, or if you are rolling out auto-refresh from the database to a large number of desktops, a DNS-less connection string [149]may be preferable. For examples of various connection types and an exlanation of easy-administration connection strings, see the KnowledgeBase. [148] |
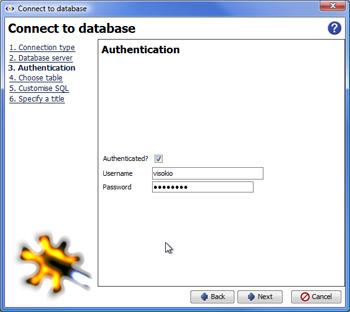 | 3. Authentication: if access to the database view/table is authenticated, tick the box and supply the Username and Password combination to be used whenever the file is refreshed. |
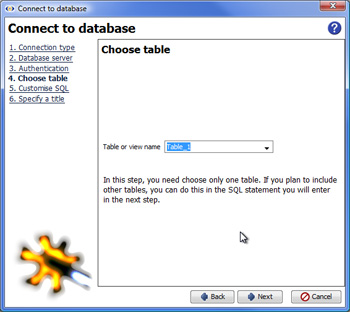 | 4. Choose Table: assuming the comprehensive data set (database reporting view) has already been created as an ODBC-required single table, enter the name here: |
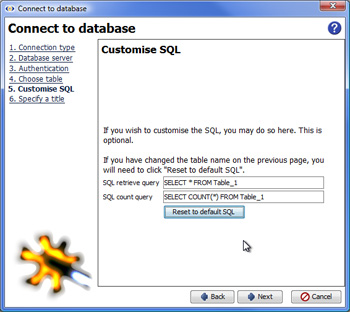 | 5. Customise SQL: If you know SQL and your database, you can modify the default statement and your statement will be saved and re-evaluated each time the file is refreshed. If there is a need to exclude some records in the linked database view/table from the Omniscope file, queries can be added to the connection. These can be refined/edited at any time using Data > Edit source. If you have several related queries, you may want to save each SQL statement in a text file and paste them in with minor variations. Note: If you want o modify the SQL statement programatically using Enterprise XML actions for automated refresh and distribution using the Scheduler watch folder [150], please contact us. |
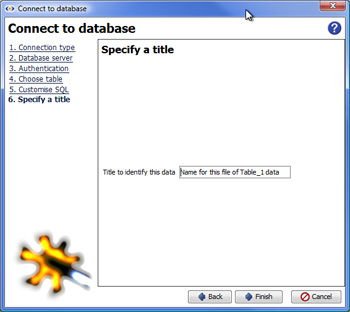 | 6. Specify a title: Choose a name for this linked relational database source, ideally a name that communicates something about the underlying SQL queries (if any) being used. |
Sometimes source data is laid out 'horizontally' in rows when Omniscope would manage it better 'vertically' in columns. Sometimes data needs to be exported from Omniscope in a layout/orientation different from that used in the Omniscope file. To avoid the time-consuming process of changing the orientation of data from horizontal to vertical (row becomes column) or vertical to horizontal (column becomes row), the Omniscope Edit menu has both a De-pivot data and Re-pivot data function.
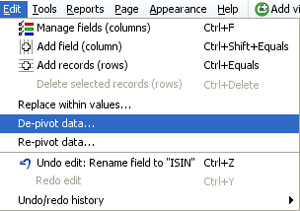
Data tables containing repeated observations of values sometimes place each set of observations in a column, such as the example of daily bond yields by ISIN identifier below. This 'horizontal' layout with the dates of each observation in a separate column is not useful for time series analysis in Omniscope, so we use the Edit > De-pivot data wizard to change the layout/orientation of the data set:
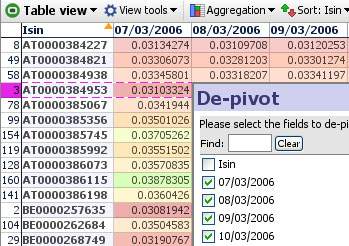
In this case, the ISIN identifier is already in a single column, so we do not need to create another column. We therefore untick this column from the list of columns to be De-pivoted as shown above.
In the new data layout, we want all the dates of reported yields/prices to be in one column, which we can re-name 'Date' or similar. Next to the new 'Date' column (the pivot series values), for each ISIN we want the observed Yield/Price for that day (the pivot cell values), which we can rename accordingly:
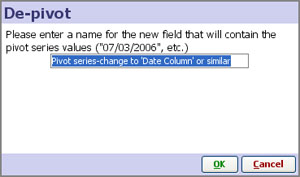
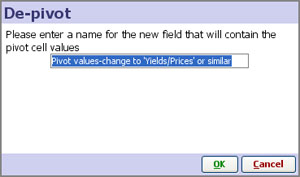
Given the information above, Omniscope will automatically change the data layout/orientation accordingly, with the ISIN reference duplicated for each date, and the column names changed to those you specified. Note: do not worry about the 'vertical' duplication of the ISIN values. This duplication is only visible in the Table View and does not appear in the reports and charts
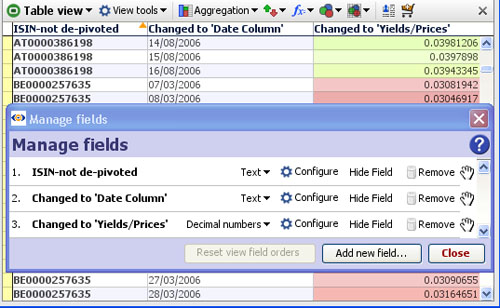
With the data now in 'vertical' Omniscope layout, we can use the Graph and other views to display the time series:
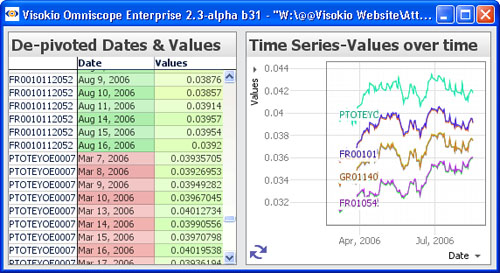
Sometimes you may need to do the reverse of De-pivoting, i.e. converting a single column into many different columns by unique values. For example, you may need to export a data set in spreadsheet format with a layout/ data orientation different from that used in your Omniscope reporting file. The Edit menu also contains a Re-pivot data function which performs these changes in data layout or orientation automatically. In the example below, we are going to convert this data set from the 'vertical' layout with the dates all in one column, to a 'horizontal' layout with a column for each date and the observations under each date.
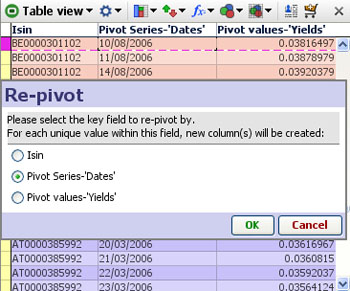
We want to keep the ISIN column as a column, so we select Dates as the pivot series as shown above, then we select Yields as the value fields to be arranged under the new date columns as shown below:
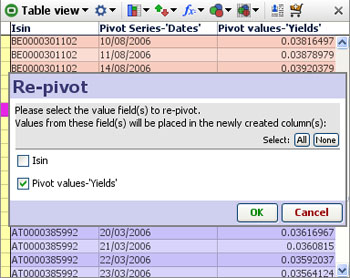
The result of the Re-pivot is a typical 'horizontal' data layout/orientation:
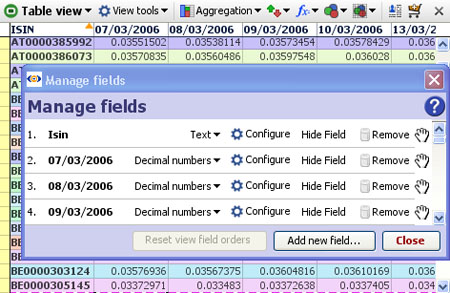
To merge data from another file into your own Omniscope file, you must have at least one column in your data matching one of the columns in the external merge file(s). For example, to use a data file such as our By Countries merge files, you must have at least one column in your data that has the names of countries, or their ISO codes, or other standard identifiers.
Note: Sample IOK merge files containing decimal geographic coordinates for countries and major cities, plus examples of other useful reference data available to merge into your data files are available here [151].
To open the Merge Data wizard, click Main Toolbar: Data > Merge and the Merge Data wizard will appear:
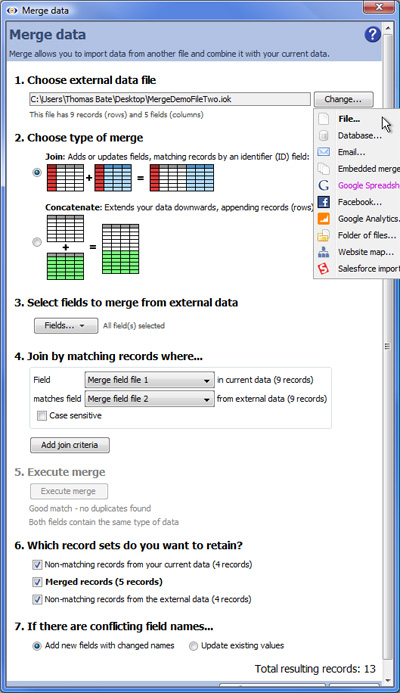 | 1. Choose external data file - point to the external merge file containing the fields (columns) you wish to add to your data set. You will need to specify what type of data source you will be merging. 2. Choose type of merge - you have a choice of two types of merge, Join or Concatenate. To add new fields (columns) to your data from a separate Merge File, choose Join. To add files with duplicate column names together, for example to combine multiple regional report files to form a single global report, choose Concatenate. (see examples below) IMPORTANT: fields being used for merge criteria may have duplicate values in one file, but not in both files. Before performing a merge, always check the uniqueness of the fields (see below) If you chose Concatenate, all the Join options will be greyed out. Scroll to the bottom and... 5. Execute Merge - for Joins, the wizard provides feedback on the matching process, reporting records in your current data not matching any incoming merge file records, exact matches and external records that do match any records in your starting file. Press [Execute merge] |
Note: If you use Date and Time fields as Join criteria, the names of the fields (columns) can be different but be sure that the format of the data in both fields is exactly the same.
SUGGESTION: Before using a field (column) as a join criteria or matching field, it is good practise to check whether the values in the matching fields in both your starting file and the incoming merge file are unique (using Table View: View Tools > Tools > Select duplicate records). If both columns are unique, for a Join the number of merged records will be the same as the number of matching records, plus any non-matching records if you choose to keep them. If your starting file's matching field has duplicate records (such as multiple addresses with the same post code), Omniscope will warn you that permutations (additional records) will be created in the resulting merged file so that all address records receive their map coordinates. If you attempt to merge two files, both of which have duplicate values in the matching fields, try to specify as many additional join criteria as you can so as to minimise the number of permutations created.
7. If there are conflicting field names...- duplicate column names are normal for Concatenations, but before accepting the results of a Join, you must choose how to treat duplicate column names, i.e fields with exactly the same name in both files. There are two options:
Add new fields with changed names - in the event of duplicate column names, Omniscope will notify you that new columns are being added and modify the names of duplicated columns by adding a (2). See example below.
Update existing values - if you choose this options all values in columns of the starting file will be overwritten by the values in the incoming file if the column names are exactly the same. If you choose this option, ensure that the data in the incoming file always supersedes the data in the starting file. See example below:
To finalise the merge, Click OK, Apply Merge to modify your file by adding in the corresponding column values from the Merge File.
WARNING: Before starting to merge, it is good practise to protect your source files from accidental overwriting by saving then with the 'Warn on save' options ticked. If you click File > Save (or Ctrl+S) after merging, your original data file will be overwritten with the merged file. If you want to preserve your original data file (recommended) be sure to use File > Save As to save the merged file as a new file with a different name.
Demo files used in this section are available for download here:![]() MergeDemoOne [152],
MergeDemoOne [152], ![]() MergeDemoTwo [153],
MergeDemoTwo [153], ![]() Concatenated [154],
Concatenated [154], ![]() JoinedAddNew [155],
JoinedAddNew [155], ![]() JoinedOverwritten
JoinedOverwritten
[156]
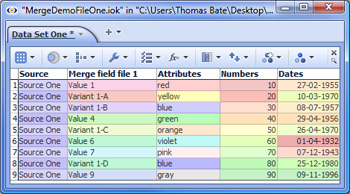 [152] [152] | 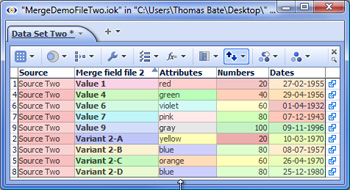 [153] [153] |
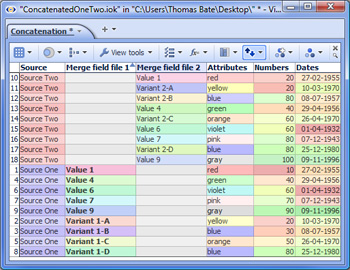 [154] [154] | Concatenating the example data files aligns all the values in columns with identical names, but not in columns with different names. Notice how in the combined file, the values in Merge field file 1 are in a different column from the values in Merge field file 2. If these values were in fact comparable, you could use cut-and-paste to move the values from the second column to the first a delete the second column. |
| Joining the data files above adding new columns for duplicate field names results in 4 new columns being added. |
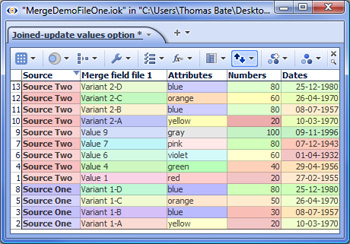 [156] [156] | Joining the data files above updating the values in the current file (Source One) with the values in the incoming or external file (Source Two) overwriting the values in the current file. |
Links:
[1] http://kb.visokio.com/main-toolbar
[2] http://kb.visokio.com/views-reference
[3] http://kb.visokio.com/commands-reference-2-4
[4] http://kb.visokio.com/commands-reference-map-2-4-to-2-5
[5] http://kb.visokio.com/file-menu
[6] http://kb.visokio.com/data-menu
[7] http://kb.visokio.com/tab-menu
[8] http://kb.visokio.com/layout-menu
[9] http://kb.visokio.com/toolbar-menu
[10] http://kb.visokio.com/settings-menu
[11] http://kb.visokio.com/help-menu
[12] http://kb.visokio.com/create-new-file
[13] http://kb.visokio.com/file-open
[14] http://kb.visokio.com/connect-to-database
[15] http://kb.visokio.com/open-image-set
[16] http://kb.visokio.com/open-folder
[17] http://kb.visokio.com/using-connectors
[18] http://kb.visokio.com/file-open-map
[19] http://kb.visokio.com/file-open-demo
[20] http://kb.visokio.com/manage-fields
[21] http://kb.visokio.com/merge-data
[22] http://kb.visokio.com/bloomberg-help
[23] http://kb.visokio.com/dipivot-repivot
[24] http://kb.visokio.com/depivot-repivot
[25] http://kb.visokio.com/configuring-styles
[26] http://kb.visokio.com/activation
[27] http://kb.visokio.com/welcome-screen
[28] http://kb.visokio.com/toolbars-menu
[29] http://kb.visokio.com/kb/proxysettings
[30] http://kb.visokio.com/commands-reference
[31] http://kb.visokio.com/table-view
[32] http://kb.visokio.com/chart-view
[33] http://kb.visokio.com/pie-view
[34] http://kb.visokio.com/bar-view
[35] http://kb.visokio.com/graph-view
[36] http://kb.visokio.com/tile-view
[37] http://kb.visokio.com/pivot-view
[38] http://kb.visokio.com/network-view
[39] http://kb.visokio.com/portal-view
[40] http://kb.visokio.com/map-view
[41] http://kb.visokio.com/venn-view
[42] http://kb.visokio.com/dial-view
[43] http://kb.visokio.com/content-view
[44] http://kb.visokio.com/web-view
[45] http://kb.visokio.com/details-view
[46] http://kb.visokio.com/dataplayer-view
[47] http://kb.visokio.com/queries-subsets
[48] http://kb.visokio.com/tools-menu
[49] http://kb.visokio.com/refresh-data
[50] http://kb.visokio.com/report-pages
[51] http://kb.visokio.com/file-menu-2-4
[52] http://kb.visokio.com/edit-menu-2-4
[53] http://kb.visokio.com/tools-menu-2-4
[54] http://kb.visokio.com/reports-menu-2-4
[55] http://kb.visokio.com/page-menu-2-4
[56] http://kb.visokio.com/appearance-menu-2-4
[57] http://kb.visokio.com/help-menu-2-4
[58] http://kb.visokio.com/tree-view
[59] http://kb.visokio.com/controls
[60] http://kb.visokio.com/side-bars
[61] http://kb.visokio.com/page-menu
[62] http://kb.visokio.com/cycling-options
[63] http://kb.visokio.com/node/244
[64] http://kb.visokio.com/node/245
[65] http://kb.visokio.com/node/247
[66] http://kb.visokio.com/node/248
[67] http://kb.visokio.com/node/249
[68] http://kb.visokio.com/node/250
[69] http://kb.visokio.com/node/251
[70] http://kb.visokio.com/kb/dataplayer-scaling
[71] http://kb.visokio.com/data-universes
[72] http://kb.visokio.com/importing-data
[73] http://kb.visokio.com/odbc-jdbc
[74] http://kb.visokio.com/node/133
[75] http://kb.visokio.com/xmldata
[76] http://kb.visokio.com/file-security
[77] http://kb.visokio.com/edit-layout-modes
[78] http://kb.visokio.com/managing-tab-layouts
[79] http://kb.visokio.com/kb/sharing-custom-styles
[80] http://kb.visokio.com/presentation-phase
[81] http://kb.visokio.com/configuring-sidebars
[82] http://www.visokio.com
[83] http://kb.visokio.com/omniscope-licensing
[84] http://kb.visokio.com/omniscope-user-guide
[85] http://kb.visokio.com/kb
[86] http://forums.visokio.com/
[87] http://kb.visokio.com/demos
[88] http://kb.visokio.com/omniscope-tutorials
[89] http://kb.visokio.com/book/export/html/529#file
[90] http://kb.visokio.com/book/export/html/529#edit
[91] http://kb.visokio.com/book/export/html/529#tool
[92] http://kb.visokio.com/book/export/html/529#repo
[93] http://kb.visokio.com/book/export/html/529#page
[94] http://kb.visokio.com/book/export/html/529#appe
[95] http://kb.visokio.com/book/export/html/529#help
[96] http://kb.visokio.com/main-toolbar-2-4
[97] http://kb.visokio.com/main-toolbar-2-3
[98] http://kb.visokio.com/node/243
[99] http://kb.visokio.com/node/369
[100] http://kb.visokio.com/node/244#export
[101] http://kb.visokio.com/node/302
[102] http://kb.visokio.com/node/374
[103] http://kb.visokio.com/book/export/html/529#top
[104] http://kb.visokio.com/node/246
[105] http://kb.visokio.com/node/339
[106] http://kb.visokio.com/config-tooltips
[107] http://kb.visokio.com/node/344
[108] http://kb.visokio.com/node/345
[109] http://kb.visokio.com/node/346
[110] http://kb.visokio.com/node/347
[111] http://kb.visokio.com/node/355
[112] http://kb.visokio.com/files/222_annotated_spreadsheet.png
[113] http://kb.visokio.com/node/352
[114] http://kb.visokio.com/node/192
[115] http://kb.visokio.com/node/242
[116] http://kb.visokio.com/node/331
[117] http://kb.visokio.com/node/332
[118] http://kb.visokio.com/node/323
[119] http://kb.visokio.com/node/233
[120] http://kb.visokio.com/node/153
[121] http://kb.visokio.com/auto-refresh
[122] http://kb.visokio.com/node/224
[123] http://kb.visokio.com/viewing-details
[124] http://kb.visokio.com/create-links
[125] http://en.wikipedia.org/wiki/Web_services
[126] http://kb.visokio.com/web-services
[127] http://kb.visokio.com/web-view-services
[128] http://kb.visokio.com/add-images
[129] http://kb.visokio.com/translations-guide
[130] http://kb.visokio.com/advanced-tools
[131] http://kb.visokio.com/kb/proxy-settings
[132] http://kb.visokio.com/kb/outside-browser
[133] http://kb.visokio.com/export-files
[134] http://kb.visokio.com/kb/scheduler
[135] http://kb.visokio.com/kb/xml-actions-spec
[136] http://kb.visokio.com/kb/xml-actions
[137] http://kb.visokio.com/files/Resources/OUGuide/382_CommandRef/00-MainToolbar202/382_MainToolbarComRef2-4/248_ReportsMenuX2-4/248ReportSectionsExample.iok
[138] http://kb.visokio.com/appearnace-menu-2-4
[139] http://kb.visokio.com/node/387
[140] http://kb.visokio.com/configuration-checklist
[141] http://kb.visokio.com/kb/hangdiagnosis
[142] http://kb.visokio.com/contact
[143] http://kb.visokio.com/omniscope-editions-comparison-chart
[144] http://kb.visokio.com/omniscope-demos
[145] http://kb.visokio.com/node/56
[146] http://kb.visokio.com/kb/activation
[147] http://kb.visokio.com/kb/dbconnections
[148] http://kb.visokio.com/kb/database-connections
[149] http://kb.visokio.com/kb/db/dsn-less-odbc
[150] http://kb.visokio.com/kb/watch-folder
[151] http://kb.visokio.com/merge-files
[152] http://kb.visokio.com/files/Resources/OUGuide/563_ImportingData/369_MergingData/MergeDemoFileOne.iok
[153] http://kb.visokio.com/files/Resources/OUGuide/563_ImportingData/369_MergingData/MergeDemoFileTwo.iok
[154] http://kb.visokio.com/files/Resources/OUGuide/563_ImportingData/369_MergingData/ConcatenatedOneTwo.iok
[155] http://kb.visokio.com/files/Resources/OUGuide/563_ImportingData/369_MergingData/JoinedDemo-AddNewFields.iok
[156] http://kb.visokio.com/files/Resources/OUGuide/563_ImportingData/369_MergingData/JoinedDemo-UpdateValues.iok
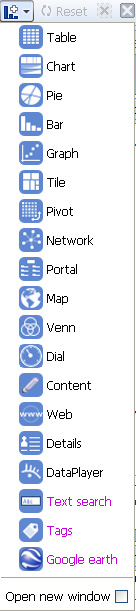
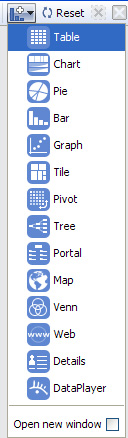

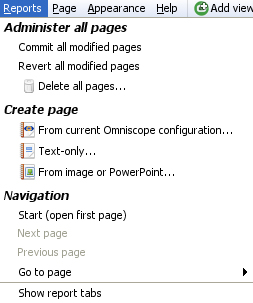
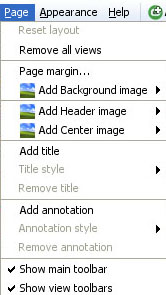
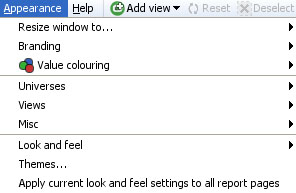
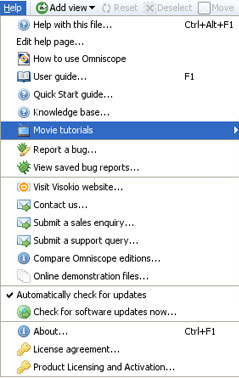
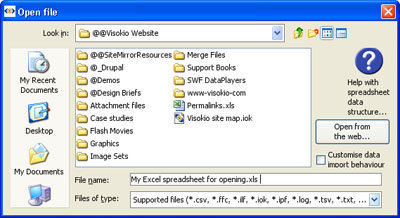
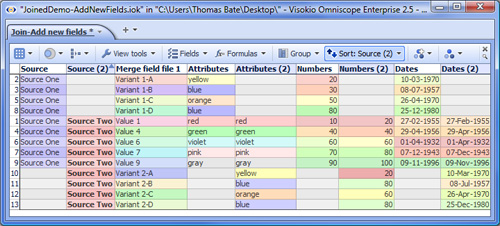
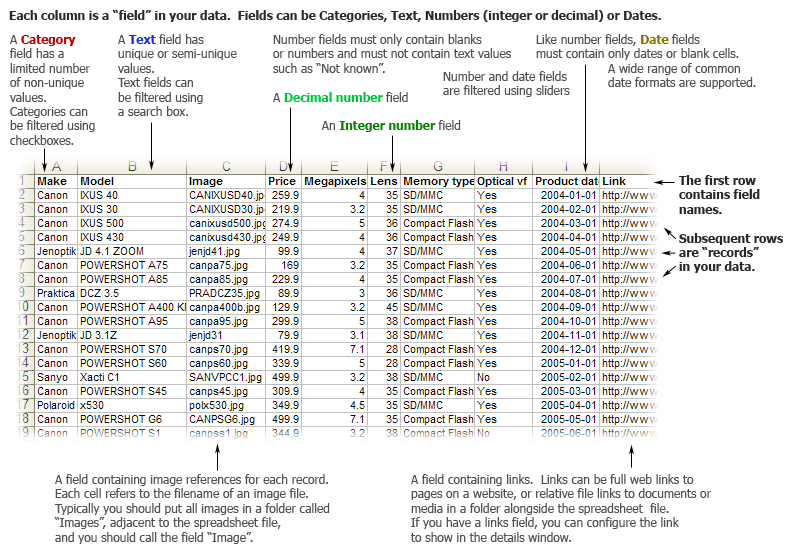