The Map View is a powerful and flexible option for displaying spatial data at any level; world, country, city or even exhibition or office floor plans or sports playing fields. Omniscope embeds its own multi-layer vector maps that let you choose to display various geographic map layers (roads, mountains, sea depths, etc.). Omniscope comes with the world map shown below, but you can also download hundreds of other free country, regional and city maps from the Maps Library [1] for embedding in your Omniscope files.
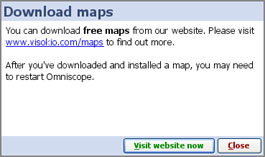
Using any activated edition of Omniscope, use the File > Open map > Download maps option to install and display new maps with blank data sets, which you can either ignore or start populating with your data. To load a scanned image or photograph for use as a backdrop, use the File > Open map > Browse for image or map file command.
Note: Omniscope currently imports Image (.JPG, .BMP, .GIF, .PNG depending on your Java version) plus Visokio's own .VEC, .MAP and .ILF file formats for use as coordinate backdrops in the Map View. If you save an .IOK file containing embedded image map(s), Omniscope will bundle them into the .IOK file so that anyone with the free Viewer will see the file with the correct map(s).
Each record (row) in your data sets can be associated with a marker displayed on the map, as long as the two designated map coordinate columns contain non-null, valid decimal coordinates. Using Place marker mode, you can add coordinates to your data set by opening a map view (or Google Maps), zooming in to show enough detail, then pointing at the location of each record with your mouse. More on Placing Markers [2]...
Details for each record are available by clicking on the marker representing the record or aggregated group of records. Note: if the Details view is not open, groups of four records or less will be displayed as a cascade of individual details windows, one per record, while markers aggregating five or more records will display the pop-up Show details table window showing the selected records with links to display individual details.
The Map View Toolbar includes the View Tools drop-down menu, an option to switch back and forth between vector and Google maps, a Map (Map Type for Google) selector, a Layer pick list, choice of mouse Mode and Zoom navigational controls, plus field (column) pick lists to set Colour, Sizing, Shape and Label options.
![]()
The Map View also features a pop-up Navigator overview mini-window, plus the Show Details, Slide Show, Add to Basket and [X] Close View options common to all views and documented here. [3]
Switch to Google/Vector Maps- to the right of the View Tools drop-down menu this option allows you to switch from the default vector map to a Google Map view which uses the same coordinate columns. When you are using Google Maps, this option label changes to Switch to Vector Map.
Suggestion: Placing, moving and correcting coordinates using the mouse in Place Marker Mode using Google Maps works well. However, if you are manually editing, deleting or cutting and pasting coordinate data with an open Google Maps display, make sure that the Zoom setting is NOT Zoom to fit visible data. If you are scrubbing and filtering data and find your Google Map display updating slowly or not displaying properly, switching to the corresponding vector map, then switching back will usually restore the display in Google Maps.
A tutorial on navigating in the Map View is available here. [4]
The Map selector is used to change the map in the view, or add a new vector map to the file. The drop-down menu shows the list of maps already configured in the file, with the currently displaying map ticked. Below that is the option to add another map from those already downloaded onto your machine, or by downloading additional maps from the Maps Library [1]. If you select to add a new, unconfigured map to the file, the Configure Map wizard will appear (see above) so that you can define a title and specify the coordinate fields (columns) to be used with the new map.
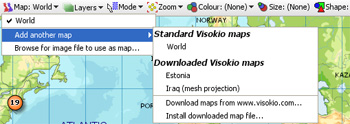
There is also an option to import your own map as an image in formats supported by your version of Java, plus Visokio Map formats (.VEC,.MAP,.ILF). Click on Browse for image file to use as a map, then browse to and select any image you choose. It will appear in the Map selector drop-down map listing menu as part of your growing collection. You can use any kind of photograph or scanned image as a Map View backdrop for placing data points. Typical examples include sporting fields, exhibition hall, office or factory floor plan layouts, banquet seating arrangements etc.
When displaying a Google Maps as a backdrop, the Map selector becomes Map Type, and allows you to chose from 3 options for the Google Map display: Map, Satellite and Hybrid:
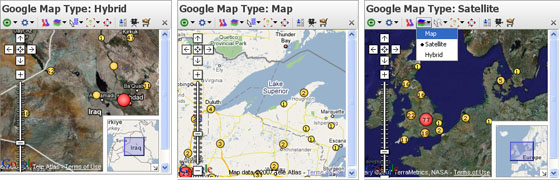
Choose one or more Google Map types that best suits the purpose of each display.
The default map is a Mercator projection world map with physical and political information in a series of configurable layers. With the default world map open, click ‘Layers’ to choose what to display. Click 'Physical' to hide or show physical altitudes and reveal the 'Political' layer. Tick or untick layers until you have the map you want.
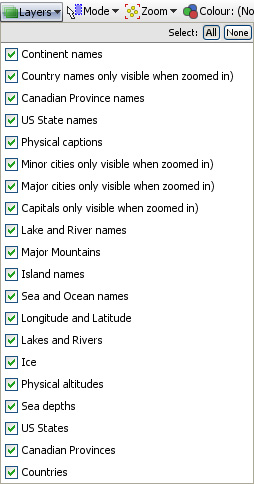
Note: some layers, such as capital, major and minor cities, will not be visible when zoomed out. Omniscope shows map detail progressively, only when the view is close enough to make sense of it. As you zoom in, more and more detail will appear, revealing the layers you have chosen.
If you would like to develop your own layers for distribution in .IOK files for display on vector or Google Maps, please contact us.. [5]
Map View selection Mode options are very similar to those used in the Graph View [6], including mouse-defined Square select and Lasso free-form selection as well as Zooming, and Panning navigational modes.
The Mode options menu enables you to choose how to navigate and select points and groups of points on the display. You can define one or more selection areas/shapes in order to exclude or isolate records using ![]() Move and
Move and ![]() Keep power query commands on the Main Toolbar. You can also use the mouse in navigational mode to define and explore specific zones in the display in maximum detail.
Keep power query commands on the Main Toolbar. You can also use the mouse in navigational mode to define and explore specific zones in the display in maximum detail.
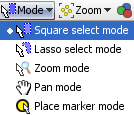 | Square select mode- the mouse defines one or more rectangular selection area(s) Lasso select mode- (not available in Google Maps) the mouse defines one or more free-form shaped selection area(s) Zoom mode- a navigational mode, the mouse defines a rectangular zone and the display zooms to show only that area. Holding the right mouse button down in zoom mode and moving the mouse up and down will zoom in and out continuously Pan mode- (only visible when zoomed in manually) a navigational mode, the mouse 'hand' cursor is used to 'grab' the screen and move it to frame the desired area. |
Place Marker mode- used to place markers for selected records, thereby generating values for the coordinate fields in the data. To do this, open a Table View and select a record with no coordinates/map marker by clicking the row header (or multiple records using the Shift or CTRL keys). Once selected. go to the open Map View, and with Mode set to Place marker mode, click on the point you want to locate the selected records on the map. In the case of the Visokio and Google world maps, the correct decimal longitude and latitude values will be placed in the coordinates columns. In the case of other maps, the coordinates will be relative to the specific map. For more detail, see Placing Markers [2].
The Map View Toolbar Zoom selector is also very similar to that used in the Graph View. The slider and Zoom out or Zoom in controls increase or reduce the magnification, changing the area and amount of detail/layers displayed.
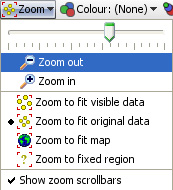 | Zoom to fit:
|
Show zoom scroll bars- when ticked, displays the zoom scroll bars bottom and sides at all times, even when zooming is not active.
Marker Colour, Size and Shape options are all defined with field pick lists available under each of these Toolbar options. If any of these options (or the Marker outline colour by option available in Marker options-see above) are set, the Key display also appears to help the reader relate the appearance of each marker to the underlying data.
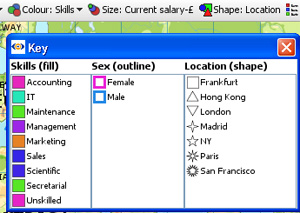
NOTE: You set the colour and shape associated with each different field (column) values using Data > Manage Fields available from the Main Toolbar. The intensity of the relative sizing effect is controlled with the Size and Range sliders in the Marker options Advanced menu (see above).
The Label drop-down selector enables you to choose the field to display next to all unaggregated markers. Aggregated markers show the label (mixed) until zooming or selection results in disaggregation to a single record.
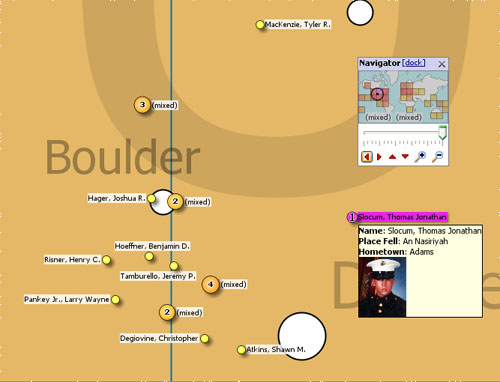
Labelling is displayed for all unaggregated records. Selecting a record can also trigger the display of Tooltips, which cam include associated images. Tooltips are configured for all views using Settings > Tooltips > Fields from the Main Toolbar.
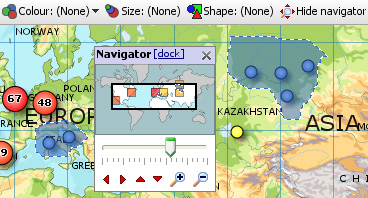
Click the ‘Navigator’ button to show a small map navigation and view control window that can be placed anywhere on screen. Moving the zooming slider, or clicking the (+) Zoom in, or (-) Zoom out icons increases or decreases the magnification, which reduces or increases the coverage area shown in the thumbnail map framing window. Clicking the red vertical and horizontal arrows in the Navigator moves the small framing window around the thumbnail map. The thumbnail map in the Navigator shows a heat map of record density, and selected areas in blue. Click and drag the red thumbnail map framing window in to move around the main map.
The Map View Tools drop-down menu provides options to define maps and control the display of markers.
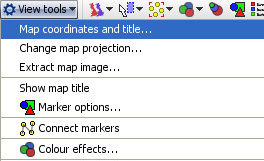
Map coordinates and title- displays the Configure Map dialog used to specify the title and coordinate fields (columns) to be used to place records on this particular map. With the correct map displayed in the view, select the fields to use as coordinates.
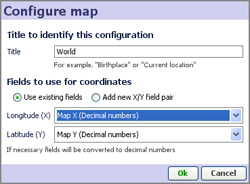 | Use existing fields- if your data sets already have columns of decimal coordinates, fully-populated or not. Most Visokio maps, including the default World map, support decimal numeric values available free from Google Earth. |
For more detail on map coordinate systems, and creating/transforming coordinate systems, see the Knowledge Base section on Maps & Coordinates. [7]
Change map projection- (not shown with Google Maps) used to create or refine coordinate systems for maps/backdrops that do not conform to the default Mercator projection decimal latitude and longitude system. This is most commonly the case with scanned images like floor plans, sports fields, some city and road maps, etc.
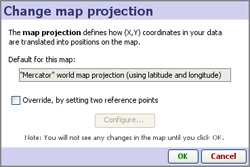 | Override, by setting two reference points- ticking this option launches the Change Map Projection wizard to define or refine the coordinate mapping. The wizard displays the map, with three advanced options to define or re-calibrate the mapping by 1) positioning corner reference points of known location, or 2) distributing the range across the entire map, or 3) using one-to-one mapping of pixels to coordinates (the default). |
For more detail on using these 3 options to determine the display of your data on a given map or image, see the Knowledge Base section on Changing Projections [8].
Extract map image- (not available with Google Maps) allows you to export a copy of the embedded vector map as an image file
Show map title- (not available with Google Maps) when ticked, displays the map title(s) in the upper left the map, in orange font as shown in the examples at the top of the page.
Marker options- clicking launches the Marker options dialog, very similar to that used in the Graph View [6]. This dialog enables you to configure how markers on displayed on the maps/scanned images you are using as backdrops for your data.
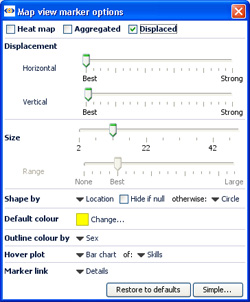 | Heat Map- (not available with Google Maps) shows density plot of records on a grid. Useful for plotting very large numbers of records that overlap a great deal. |
Displacement- (not available with Google Maps) changes the amount of displacement vertically and horizontally to improve access to data points for selection and linking.
Size slider- changes the absolute scale for marker sizing to increase or decrease all marker sizes
Range slider- (greyed-out unless the Size option is set to a field) changes the magnitude of relative sizing (see Size below)
Shape by: (not available with Google Maps) selects the field (column) whose values will determine the shapes plotted (same as Shape: toolbar pick list below) with additional options to specify the display of markers of records which are null (blank, not zero) in the selected Shape by field. In Simple mode, the Default shape to use when no Shape-by field has been chosen can be set.
Default shape/colour- selects the default colour of markers when no other colouring options are set.
Outline colour by: (not available with Google Maps) adds an outline of another colour, based on another field. For example, if 'Sex' is used, this command would put a blue outline on the dots representing Males and a pink outline on the dots representing Females- assuming that you have assigned the those colours to the values 'Male' and Female'.
Hover plot- (not available with Google Maps) sets a pop-up display of either a pie or a bar chart whenever the user hovers on a marker, aggregated or not. When set, you can select the field (column) to be charted using the pick list at right, which is otherwise greyed-out.
Marker link- (not available with Google Maps) selects a link to display when markers are clicked (one record only). Pick (None), Details, or one of the links already configured in the file using the Settings > Links wizard accessed from the Main Toolbar.
Connect markers- (not available with Google Maps) similar to the option available in the Graph View [6], opens and expandable sub-menu. Use of these options with the Map View is documented here. [9]
Colour Effects- (not available with Google Maps) launches an extensive menu of options to modify the display of the map/backdrop:
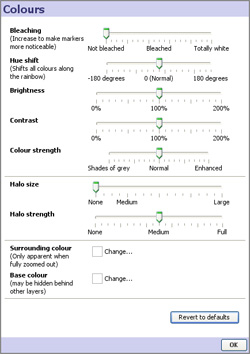 | Bleaching- reduces the intensity of the map image, making the markers more distinct.
|
{update to 2.5 on progress}
Omniscope allows you to use embedded vector maps that work offline, or online mapping services, such as Google Maps. Users can change from one zooming map background to the other within the Map View. Omniscope includes a wide selection of freely dowloadable vector maps (world, county or city level) which can be downloaded automatically and added into any file. Coordinate data in your data set is automatically plotted on maps or scanned images, such as floor plans. Markers can also be placed manually and Omniscope will automatically capture the coordinates to your data set. For more information on freely downloadable maps and how to use them, please visit our Maps Library [10].
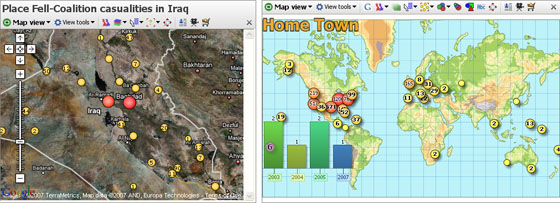
Omniscope permits you to have multiple map views, using either vector maps (work offline) or Google Maps backdrops (work online only). The example below shows both vector and Google Maps being used to display the same coordinate data, visible in the Table View at the bottom (click image to see larger version in a separate window).
 [11]
[11]
Map Views allow easy zooming, selection and filtering of records (rows) based on location. You can use mouse mode controls and zoom options to manage the display, and then select groups of records on which to perform Move or Keep power queries.
To learn more about navigating, selecting and filtering, see the User Guide section Using the Map View [12], and the KnowledgeBase sections on Maps & Coordinates [13].
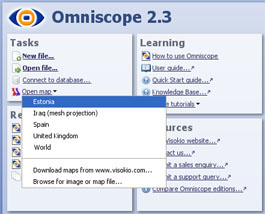
You can add embeddable vector maps to your local library and files from the File > Open map command, which is also accessible from the opening desktop Tasks menu. Downloading a map from our Maps Library [10] adds it to your local collection. If you use the map in a file shared with others, and they do not have the map, it will be automatically downloaded for use in the file. It is also possible to embed maps in files if necessary.
 |  |
You can use any type of scanned image as map- floor plans, sports fields, logistics and supply chain charts, etc. To learn how to calibrate coordinates for display on scanned images rather than map projections, see Changing Projections [14] in the Knowledge Base.
Every map defined in Omniscope requires you to specify two columns to contain the Longitude (X) and Latitude (Y) coordinate values used to plot the records (rows) on the map. There are currently three ways to add geographic decimal coordinate (longitude and latitude) column values to your data for map displays;
1.) Locate your records in Omniscope using the free Visokio world, country and city vector maps- just select each record in the table view and place the markers manually to generate the coordinates in new fields (columns) automatically;
2.) Look up missing coordinates using online sources for finding coordinates such as Google Earth (and often Wikipedia). In Google Earth, look up the missing places, set a placemark, then read off the placemark coordinate values, then type or cut-and-paste the two Longitude and Latitude values into Omniscope columns;
3.) Merge the columns into your Omniscope data automatically using a merge file [15]. To merge in coordinate columns for capital cities or geographic centres of countries, we supply free 'By Countries' [15]merge file containing these columns. We also supply a free 'By Cities' [16]merge file containing coordinates for about 60,000 of the world's largest cities. Free merge files 'By post code' [17]are also available for the UK and the U.S., and a growing number of other countries as well. Other free and licensed reference merge files may be available from data vendors in future.
To learn more, see the User Guide section Using the Map View [12], and the Knowledge Base sections on Maps & Coordinates [13].
Map projections define how the (X,Y) coordinates in your data set are displayed over imported images/maps used in the Map View. Omniscope allows you to calibrate or define coordinate grids on any kind of map, photo or scanned image imported for use as a map. For example, you can use an online mapping service to zoom into a specific area, then take a screenshot and use that image as a map background in your Omniscope file.
The Omniscope Map View [18] Toolbar View Tools menu (or the Configure Map View wizard in DataPlayer View) includes the command Change map projection. If your X,Y coordinate columns in your data set is consistent with the default projection for Omniscope maps (Mercator projections using decimal latitude and longitude coordinates as used by free services such as Google Maps/Earth), you will not need to use this command. However, if you are using a scanned image as a background map, or maps that are not consistent with the Mercator standard projection, you may need to tick the Override, by setting two reference points option.
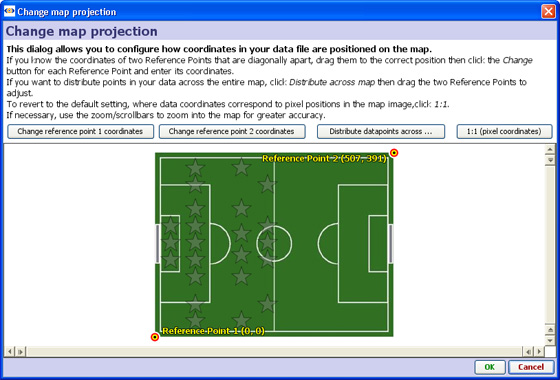
This dialog allows you to configure and refine how coordinates in the data file will be positioned on your map. There are 3 options:
Option 1. You know the coordinates of specific points on the image - If, for example, you have imported a screenshot image of New York's streets (from Google Maps or other online zooming map service) and you have coordinates in your data set in some form of grid reference (such as latitude and longitude, which on a small scale are linear), and you know the coordinates of reference points, (say, two street intersections) that are diagonally apart (looked up in Google Earth, for example), you would use Change Reference Point Coordinates 1 and 2 to ensure points in your data set will plot in the correct location. Drag the two reference points on your image to where each of your reference crossroads are located, then click the Change Reference Point buttons to enter the correct coordinate locations for each crossroad.
Option 2. You want the points distributed across the image- for example, you might have a data file of events during a game on a soccer pitch, and have imported a picture of the pitch to use as a map. You place corner events in two opposite corners of the pitch image. The coordinate system in your data file could be arbitrary, but assuming events happened across the entire pitch, you would click Distribute data points across map and the application would work out the transformation so as to "normalise" the points correctly.
Option 3. You want the data points to map to the pixels in the image (default). To revert to the default setting, where data coordinates correspond to pixel positions in the image, click 1:1 (pixel coordinates).
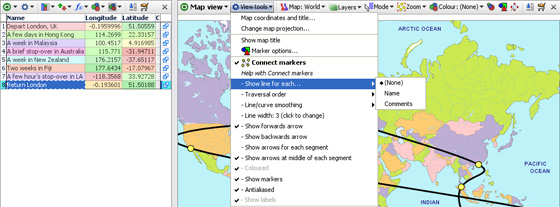
This section demonstrates how to use the Connect Markers option in the Map View to draw a path around the map. You can download this example file showing a holiday around the world here. [19] The various display commands on the expanded sub-menu are documented below.
Start Omniscope and select File > Open map, then choose World. A new empty file will be created and opened, showing the Map View and the installed World Map, ready for adding markers.
From the Map View View Tools menu choose Connect Markers. Since you don't have any markers yet, you won't see any change.
From the Mode drop-down in the Map view, choose Place marker mode. The mouse pointer will change to a cross-hair when over the map. Move to the first location in the trip (for example, London in the UK), and click the left mouse button. The Add record dialog will appear. Type in a summary of this location, and press Enter or click OK. For example, 'Depart London, UK'. Move the mouse pointer to 'hover' over this marker. You'll see a Tooltip appear with the text you have entered.
Now click the Map View Navigator button to show the Map Navigator, and use the controls to zoom in and pan around until you can see the next location accurately. Click to add another marker, and enter the description. For example, zoom into Hong Kong and add a marker with the text 'A few days in Hong Kong'.
You'll see a black line joining the marker from the previous point. Carry on zooming into cities and adding markers and text until you've finished the path around the map. You can add more information by adding fields (columns) using Data > Manage Fields [20] to add fields (columns), and then entering data into your new fields from the Table View [21], which you can open using ![]() Add View.
Add View.
Click the Map View Mode drop-down again and change to Zoom mode to avoid accidentally placing markers. Open the Mode drop-down again and click Zoom to fit map. You'll see the entire trip with a black line joining the markers. Hover the mouse pointer over a marker and you'll see the text for that point. If you don't like the "line/curve smoothing", you can adjust or turn this off from within the View Tools menu.
Traversal Order (showing an omni-directional path) By unticking Time series (connect markers by X axis), you can choose to draw the lines in a different order than dictated by the X axis. If you are plotting data based on criteria other than time, configure the Traversal order field appropriately.
Show moving average: None; Simple & Exponential- If you have many data points in each time series, you may wish to try showing a moving average, by choosing Simple, Exponential or other data smoothing options on the sub-menu.
Line/curve smoothing- By default, lines are turned into curves while preserving data points. In other words, curves are drawn between the data points. Depending on your data, this may be inappropriate. You can disable this using the Line/curve smoothing sub-menu. Alternatively, a second form of curve smoothing is provided, which does not pass through the data points. Untick Curves pass through vertex points to use this option. Both forms of smoothing can be adjusted for amount of smoothing using the Smoothing amount option.
Line width-By default, lines are shown 2 pixels thick. Use the slider to change this any value between 1 and 25 pixels.
Arrows: Show forward arrow; backward arrow; arrows for each segment; middle of each segment-adds different kinds of directional arrow heads to the line segments displayed
Coloured- By default, if you have multiple lines displayed, these are coloured according to the values in the Category field. You can disable this and show only black lines by deselecting this option.
Show markers- Hides or reveals the markers within the plotted lines (to resize markers, see Marker Options on the View Tools menu
Anti-aliased- Smooths the way the line is displayed
Show labels- By default, text labels will be shown beside each line if you have multiple lines. By de-selecting Show labels, these will only be shown as you move the mouse pointer over a line.
The section on Time Series [22] also covers advanced options for the Time Series > Connect Markers functions, most of which are the same in the Map View.
All Visokio applications come with embedded world maps (Mercator projection) and will plot records (rows) according to decimal latitude and longitude coordinates contained in two selected fields (columns) of your data sets. If your data does not yet contain map coordinates, you may be able to add them automatically using a Merge File, or you can populate the fields manually using Visokio maps and the Place Marker process [2].
This brief tutorial explains how to:
|
|
Opening MapsChoose File > Open map and choose any map from the list to create a new, empty .IOK file showing only the chosen map. You can add maps to your list from the Maps Library [1]. |
Zooming inInitially, the Map View opens in Zoom Mode,indicated by the magnifying glass mouse cursor. In Zoom Mode, you can click and drag the mouse to zoom in and out on selected areas of the map. To zoom in, click on a central point of interest, or click and drag (press and hold a mouse button while moving the mouse) to draw a rectangular 'zoom' box over an area. To zoom out, right-click anywhere on the map and use the slider or the (-) Zoom out |
| Viewing layersOmniscope maps have many layers that can be either hidden or shown. Layers contain feature-specific detail available on the maps, such as 'Capitals' or 'waterways'. Note: some of the details in some layers are only visible |
 | Managing layers Tick or untick the boxes next to any layers you wish to display or hide. For example, at left we've removed the physical layer (which includes relief shading). The result is to display the map coloured by political boundaries rather than topology. |
| Using the Map NavigatorClicking on the Map Navigator icon launches a floating tool that speeds focusing on specific areas of the map. The slider and magnifying glass tools manage zooming in and out. You can grab the sides of the mini-frame to move it and change the scope of the display. The four red arrows below move the focus frame in the direction they point. |
| Placing MarkersMissing map coordinates associated with a given record (row) can be added/changed manually. On the View Toolbar, click on the
|
Use | |
| Selecting RecordsClick on the |
| Viewing DetailsSelect an area on the map containing one or more data points. The area will be framed in blue. Click on Clicking on a single marker will display details for just that record |
Links:
[1] http://kb.visokio.com/kb/maps-library
[2] http://kb.visokio.com/node/267
[3] http://kb.visokio.com/node/204
[4] http://kb.visokio.com/node/130
[5] http://kb.visokio.com/company#contact
[6] http://kb.visokio.com/node/227
[7] http://kb.visokio.com/node/153
[8] http://kb.visokio.com/node/357
[9] http://kb.visokio.com/node/262
[10] http://kb.visokio.com/maps
[11] http://kb.visokio.com/files/Resources/OUGuide/396_UsingMaps/396_4Maps_800x594.jpg
[12] http://kb.visokio.com/map-view
[13] http://kb.visokio.com/kb/maps
[14] http://kb.visokio.com/kb/projection-transformation
[15] http://kb.visokio.com/merge-files
[16] http://kb.visokio.com/merge-files#cities
[17] http://kb.visokio.com/merge-files#postcodes
[18] http://kb.visokio.com/node/233
[19] http://kb.visokio.com/files/Resources/OUGuide/125_UsingViews/Map233/Connect Markers World Trip.iok
[20] http://kb.visokio.com/node/246
[21] http://kb.visokio.com/node/226
[22] http://kb.visokio.com/node/215